29
/
en
AIzaSyAYiBZKx7MnpbEhh9jyipgxe19OcubqV5w
April 1, 2024
260368
Tajikistan
TJK
true
2
1
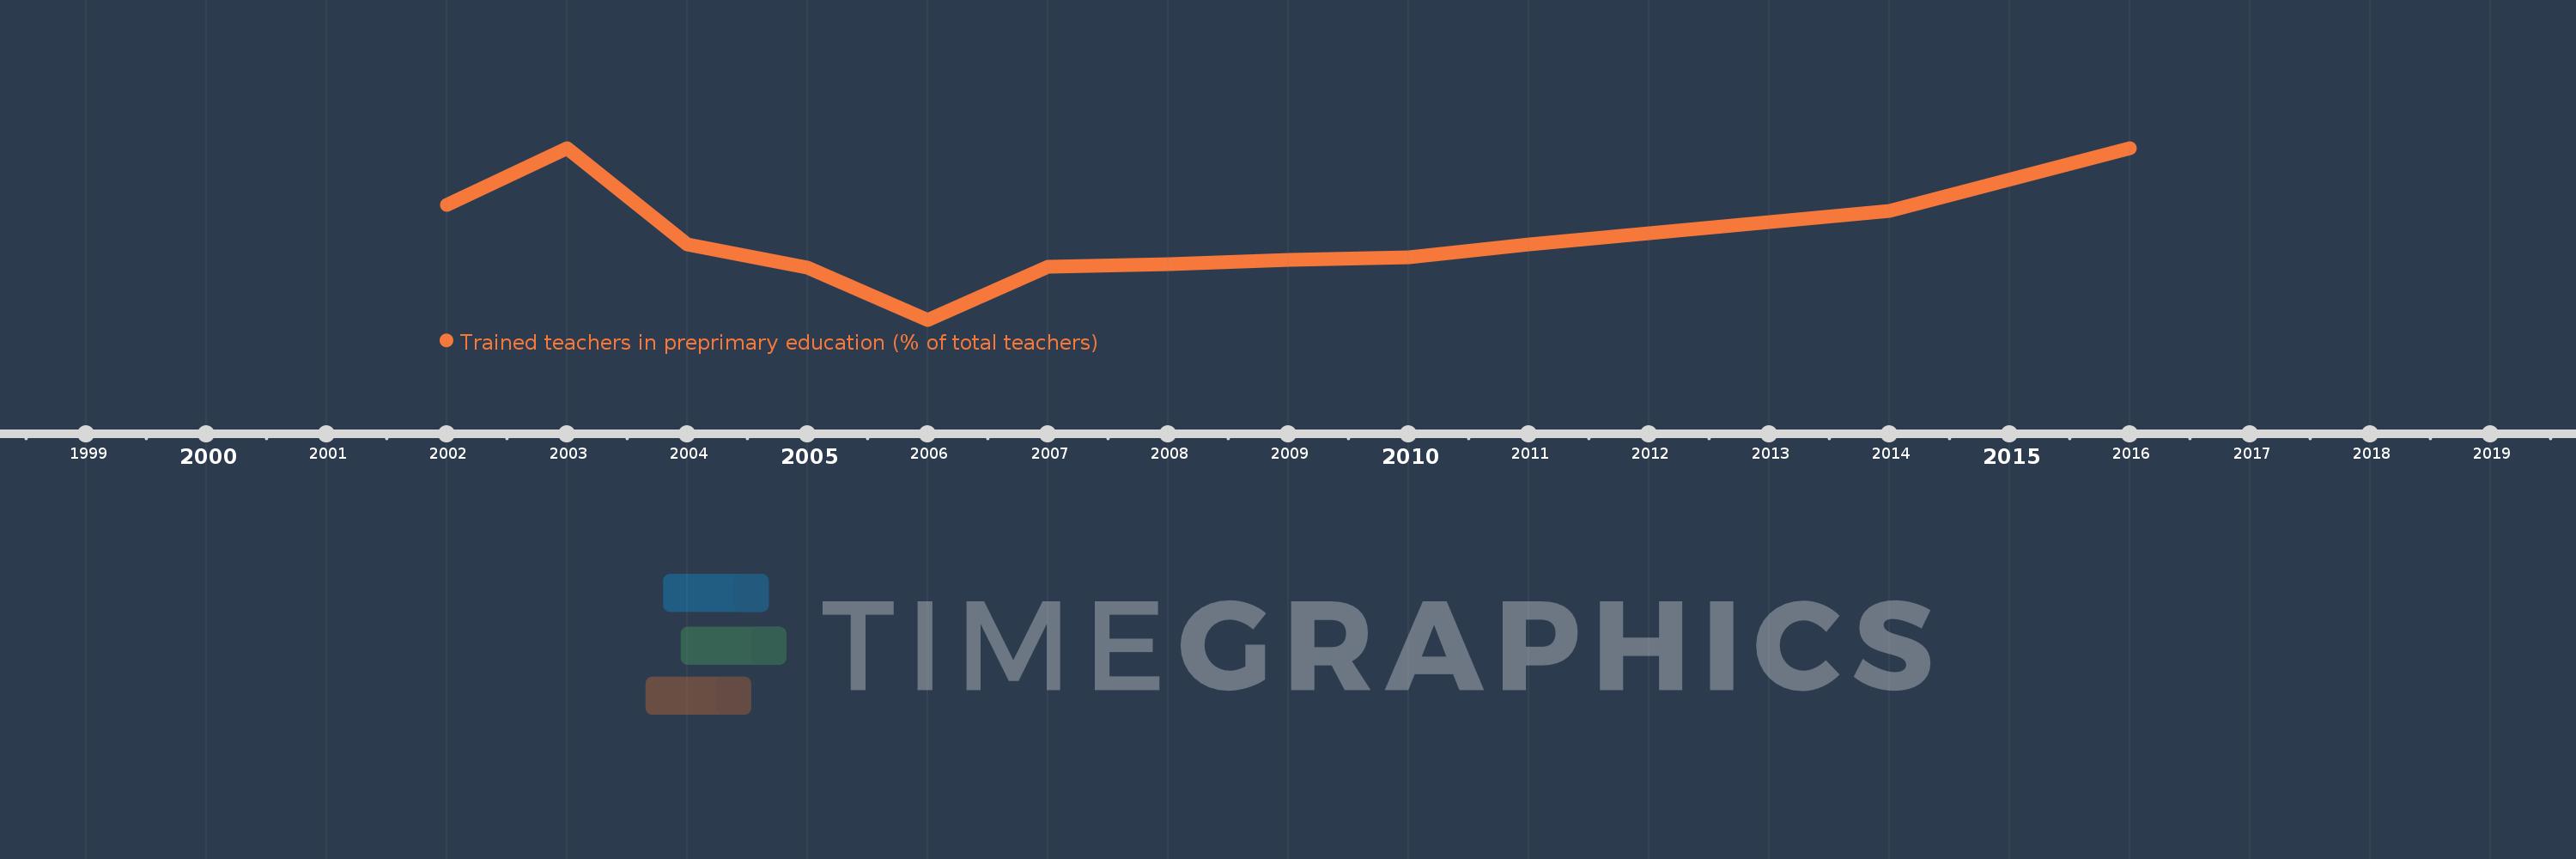
Trained teachers in preprimary education (% of total teachers)
2016,2014,2012,2011,2010,2009,2008,2007,2006,2005,2004,2003,2002
This statistics in other country:
Timeline:
This timeline shows a graph from 2002 to 2016 of Tajikistan. No data until 2001. Number of actual observations by date: 13.
Source name:
World Development Indicators
Source organization:
United Nations Educational, Scientific, and Cultural Organization (UNESCO) Institute for Statistics.
Categories, topics:
Education
Last updated:
apr 23, 2017
Indicators value changes by year
Minimum:
73.587
jan 1, 2006
At the date of observation
Value
Absolute change
Change from previous value
jan 1, 2002
91.258
+91.258
0.0%
jan 1, 2003
100.0
+8.742
9.58%
jan 1, 2004
85.161
-14.839
-14.84%
jan 1, 2005
81.561
-3.6
-4.23%
jan 1, 2006
73.587
-7.974
-9.78%
jan 1, 2007
81.766
+8.18
11.12%
jan 1, 2008
82.195
+0.429
0.52%
jan 1, 2009
82.806
+0.611
0.74%
jan 1, 2010
83.175
+0.368
0.44%
jan 1, 2011
85.19
+2.015
2.42%
jan 1, 2012
86.845
+1.655
1.94%
jan 1, 2014
90.293
+3.449
3.97%
jan 1, 2016
100.0
+9.707
10.75%
Ranking of countries by current statistics by years


Comments: