29
/
en
AIzaSyAYiBZKx7MnpbEhh9jyipgxe19OcubqV5w
April 1, 2024
131283
Ethiopia
ETH
true
2
1
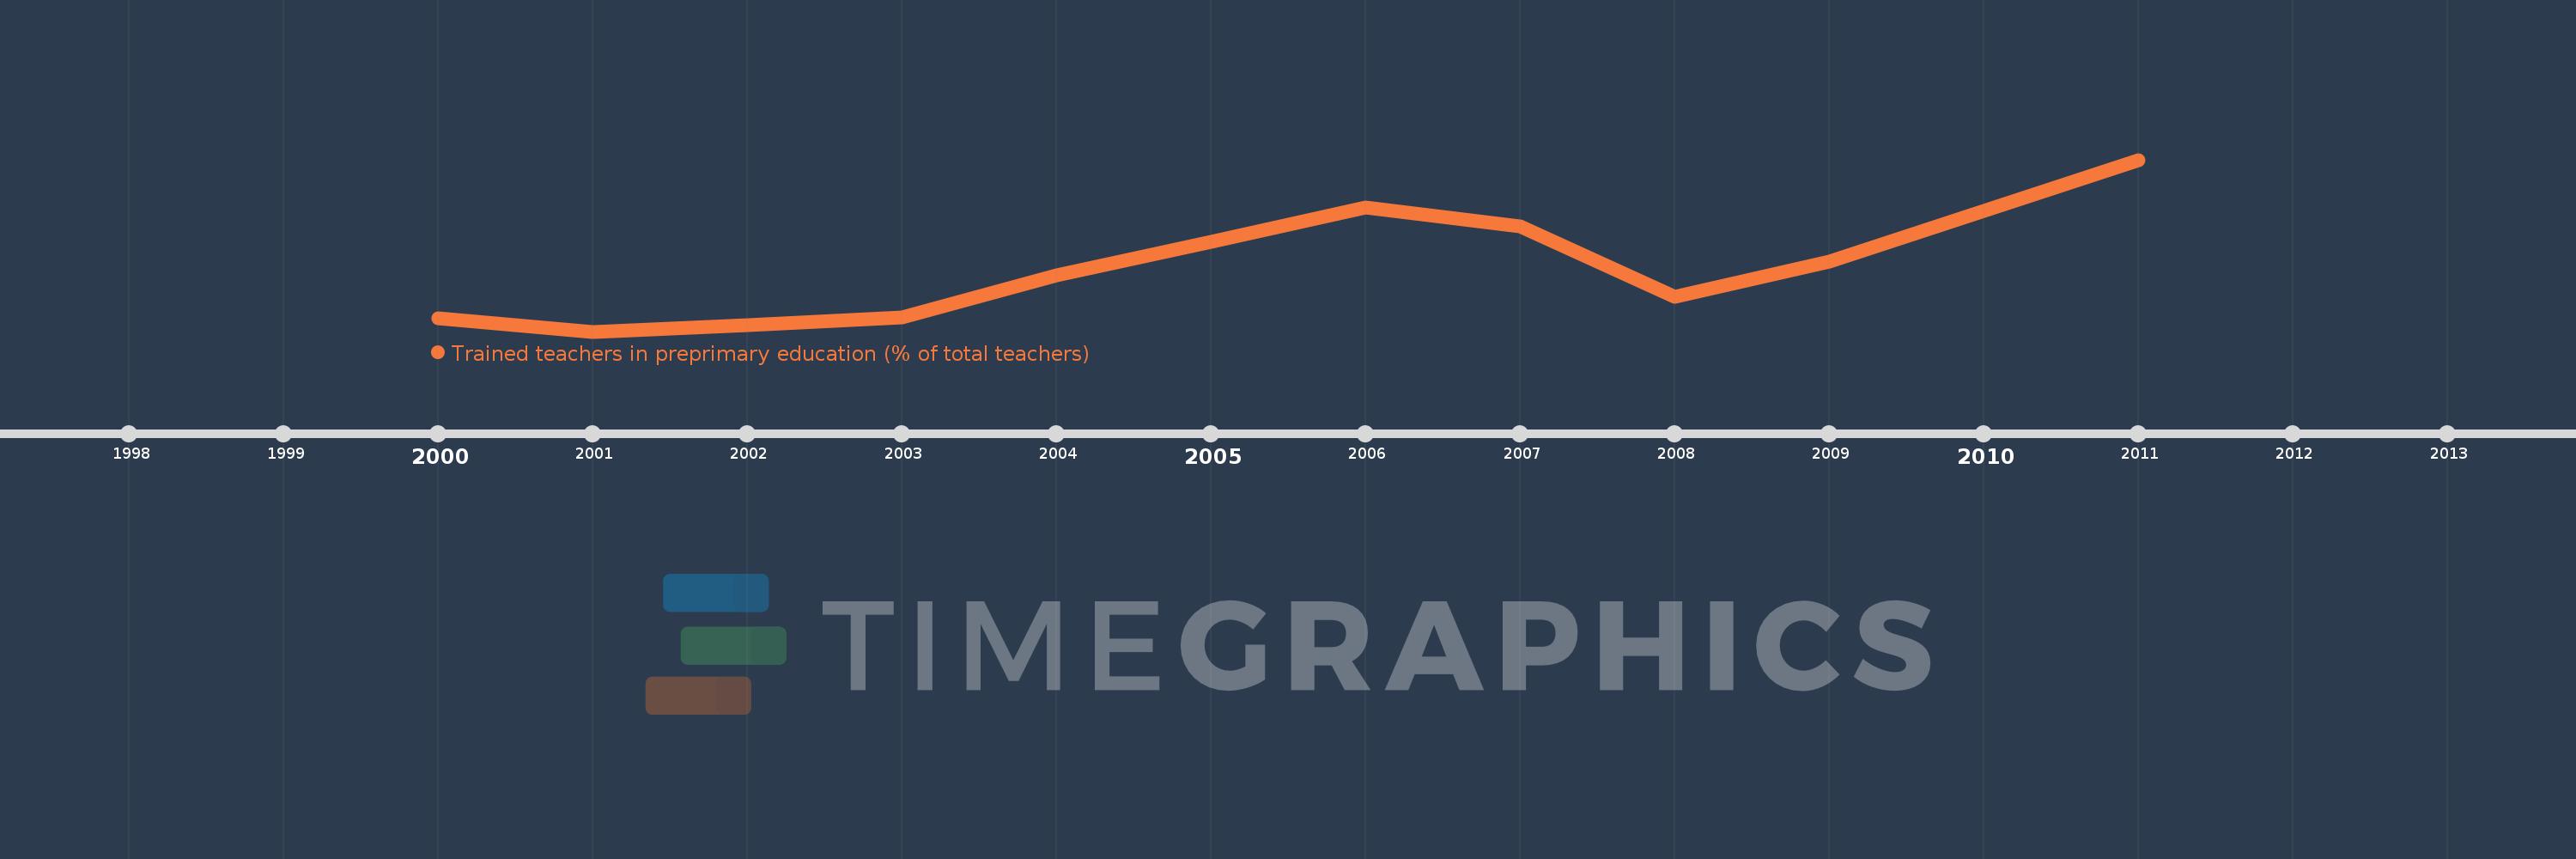
Trained teachers in preprimary education (% of total teachers)
2011,2009,2008,2007,2006,2005,2004,2003,2002,2001,2000
This statistics in other country:
Timeline:
This timeline shows a graph from 2000 to 2011 of Ethiopia. No data until 1999. Number of actual observations by date: 11.
Source name:
World Development Indicators
Source organization:
United Nations Educational, Scientific, and Cultural Organization (UNESCO) Institute for Statistics.
Categories, topics:
Education
Last updated:
apr 23, 2017
Indicators value changes by year
Minimum:
61.196
jan 1, 2001
At the date of observation
Value
Absolute change
Change from previous value
jan 1, 2000
63.048
+63.048
0.0%
jan 1, 2001
61.196
-1.852
-2.94%
jan 1, 2002
62.103
+0.908
1.48%
jan 1, 2003
63.166
+1.063
1.71%
jan 1, 2004
69.133
+5.967
9.45%
jan 1, 2005
73.976
+4.843
7.0%
jan 1, 2006
78.73
+4.754
6.43%
jan 1, 2007
76.124
-2.606
-3.31%
jan 1, 2008
66.159
-9.965
-13.09%
jan 1, 2009
71.074
+4.915
7.43%
jan 1, 2011
85.54
+14.465
20.35%
Ranking of countries by current statistics by years


Comments: