29
/
en
AIzaSyAYiBZKx7MnpbEhh9jyipgxe19OcubqV5w
April 1, 2024
83579
Belize
BLZ
true
2
1
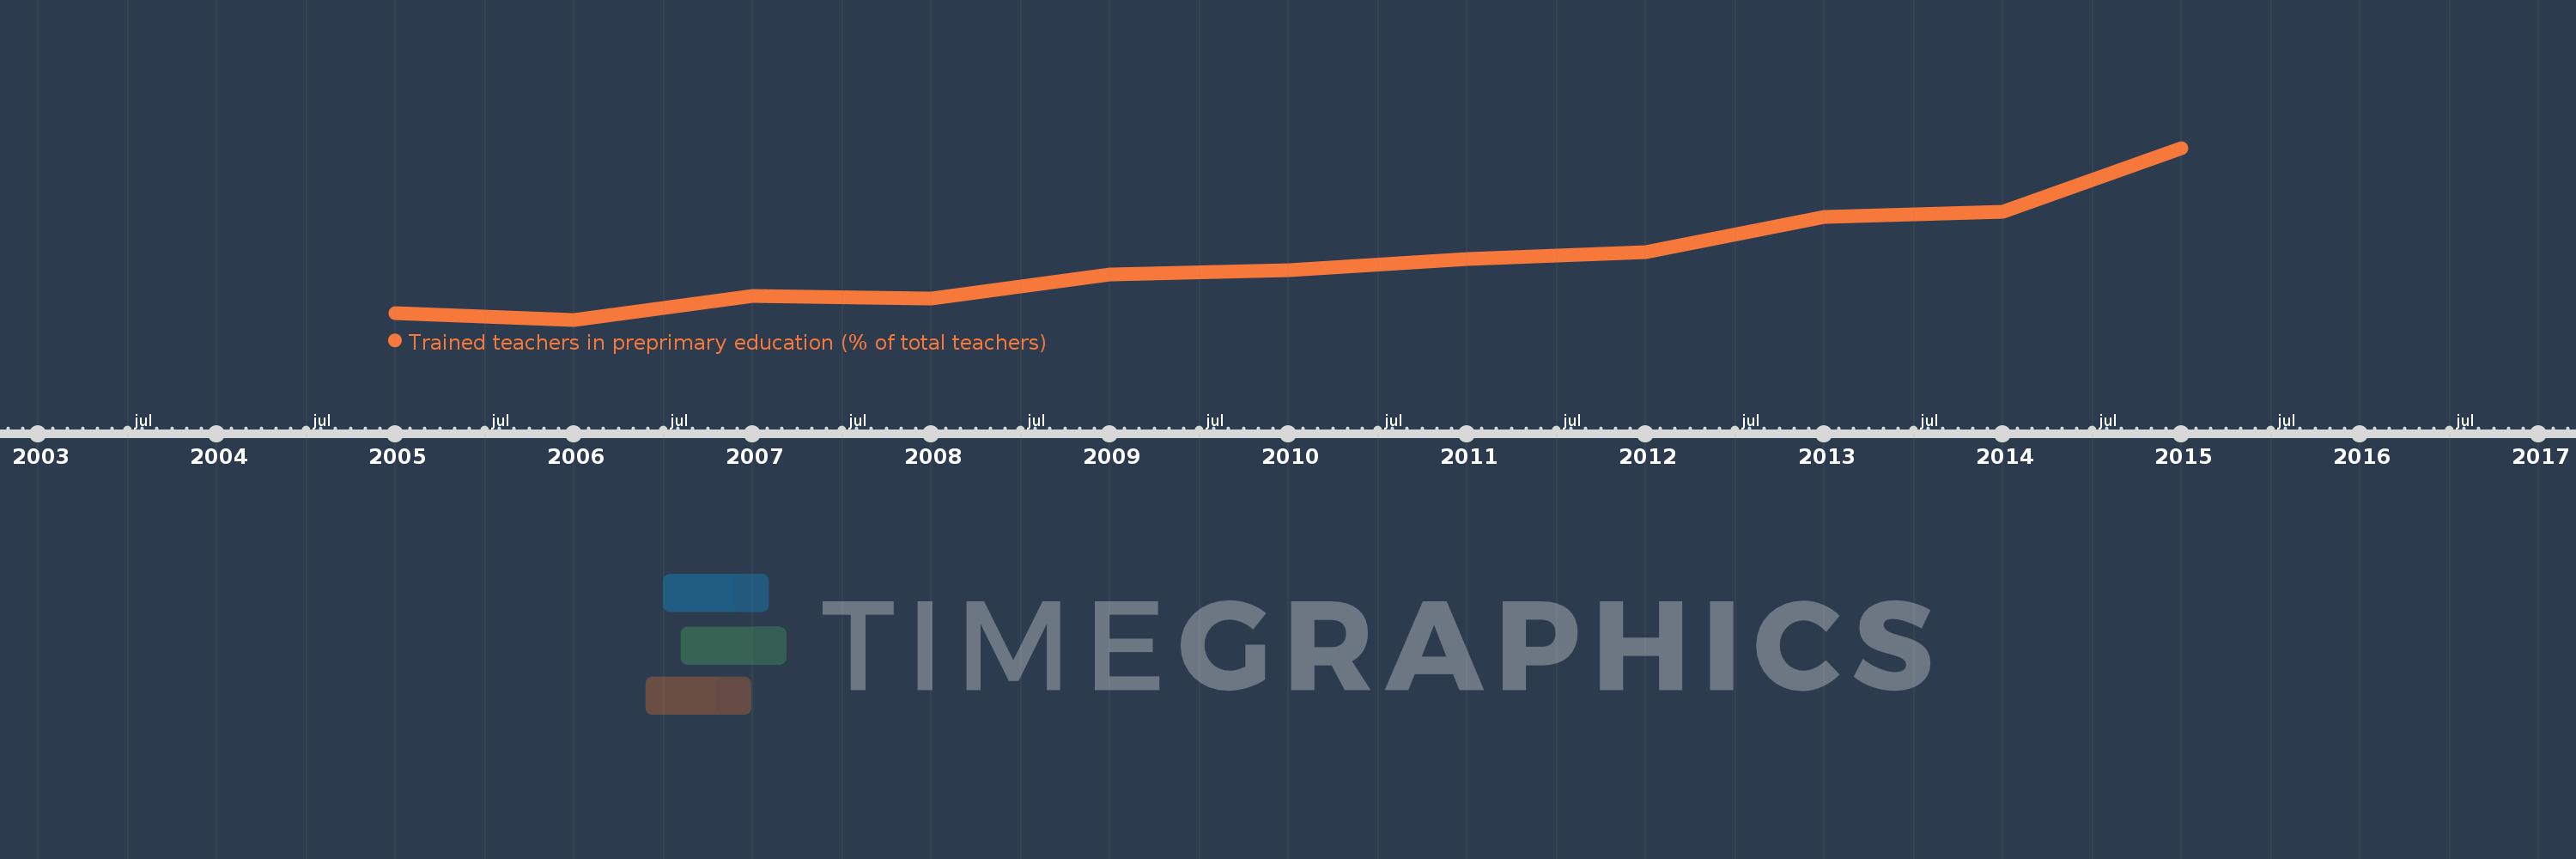
Trained teachers in preprimary education (% of total teachers)
2015,2014,2013,2012,2011,2010,2009,2008,2007,2006,2005
This statistics in other country:
Timeline:
This timeline shows a graph from 2005 to 2015 of Belize. No data until 2004. Number of actual observations by date: 11.
Source name:
World Development Indicators
Source organization:
United Nations Educational, Scientific, and Cultural Organization (UNESCO) Institute for Statistics.
Categories, topics:
Education
Last updated:
apr 23, 2017
Indicators value changes by year
At the date of observation
Value
Absolute change
Change from previous value
jan 1, 2005
7.207
+7.207
0.0%
jan 1, 2006
6.25
-0.957
-13.28%
jan 1, 2007
9.574
+3.324
53.19%
jan 1, 2008
9.278
-0.296
-3.09%
jan 1, 2009
12.644
+3.365
36.27%
jan 1, 2010
13.228
+0.584
4.62%
jan 1, 2011
14.815
+1.587
12.0%
jan 1, 2012
15.738
+0.924
6.23%
jan 1, 2013
20.642
+4.904
31.16%
jan 1, 2014
21.33
+0.688
3.33%
jan 1, 2015
30.31
+8.979
42.1%
Ranking of countries by current statistics by years


Comments: