29
/
en
AIzaSyAYiBZKx7MnpbEhh9jyipgxe19OcubqV5w
April 1, 2024
201612
Morocco
MAR
true
2
1
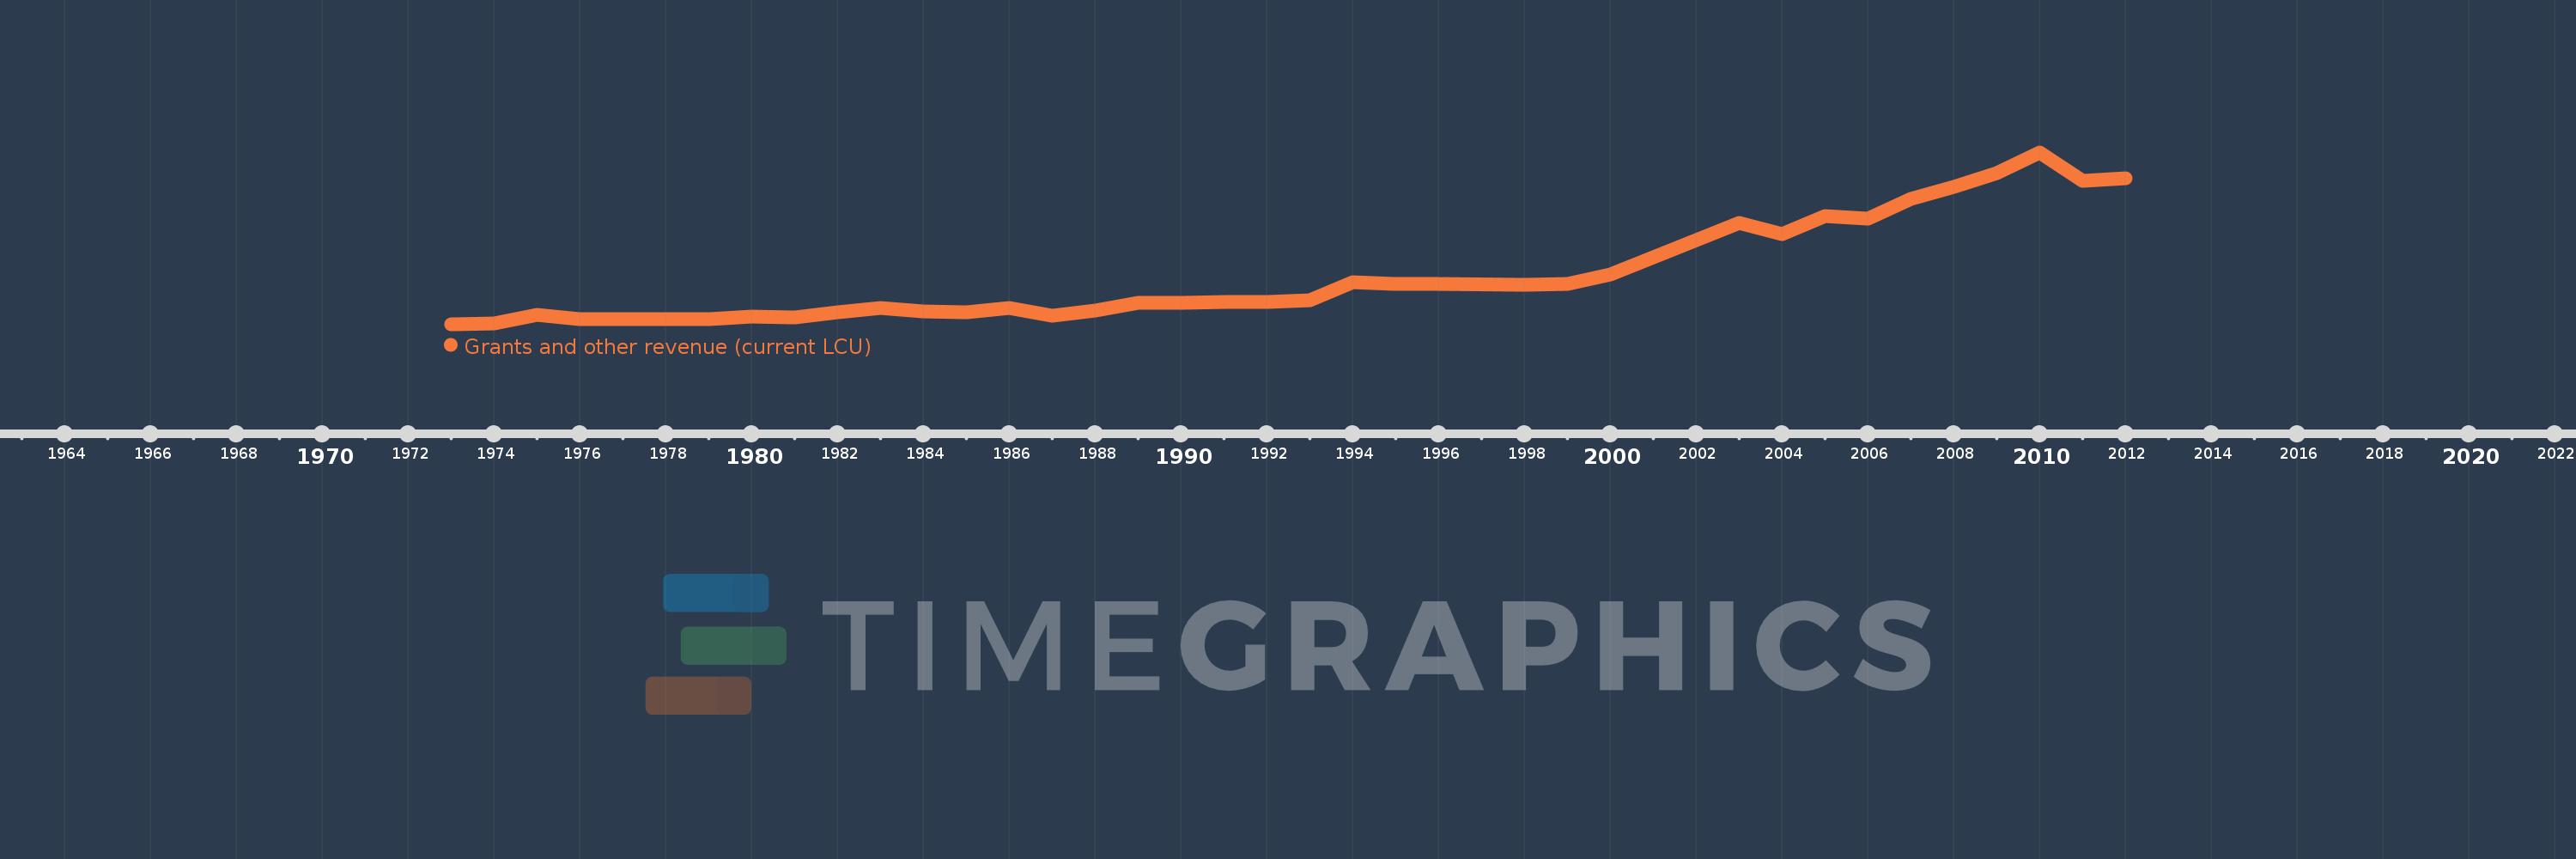
Grants and other revenue (current LCU)
2012,2011,2010,2009,2008,2007,2006,2005,2004,2003,2000,1999,1998,1996,1995,1994,1993,1992,1991,1990,1989,1988,1987,1986,1985,1984,1983,1982,1981,1980,1979,1978,1977,1976,1975,1974,1973
This statistics in other country:
AfghanistanAlbaniaAlgeriaAngolaAntigua and BarbudaArgentinaArmeniaAustraliaAustriaAzerbaijanBahamas, TheBahrainBangladeshBarbadosBelarusBelgiumBelizeBeninBhutanBoliviaBosnia and HerzegovinaBotswanaBrazilBulgariaBurkina FasoBurundiCabo VerdeCambodiaCanadaCentral African RepublicChileChinaColombiaCongo, Dem. Rep.Congo, Rep.Costa RicaCote d'IvoireCroatiaCyprusCzech RepublicDenmarkDominicaDominican RepublicEgypt, Arab Rep.El SalvadorEquatorial GuineaEstoniaEthiopiaFijiFinlandFranceGambia, TheGeorgiaGermanyGhanaGreeceGrenadaGuatemalaHondurasHong Kong SAR, ChinaHungaryIcelandIndiaIndonesiaIran, Islamic Rep.IraqIrelandIsraelItalyJamaicaJapanJordanKazakhstanKenyaKiribatiKorea, Rep.KuwaitKyrgyz RepublicLao PDRLatviaLebanonLesothoLiberiaLithuaniaLuxembourgMacao SAR, ChinaMacedonia, FYRMadagascarMalawiMalaysiaMaldivesMaliMaltaMauritiusMexicoMicronesia, Fed. Sts.MoldovaMongoliaMoroccoMozambiqueMyanmarNamibiaNepalNetherlandsNew ZealandNicaraguaNigeriaNorwayOmanPakistanPanamaPapua New GuineaParaguayPeruPhilippinesPolandPortugalQatarRomaniaRussian FederationRwandaSamoaSan MarinoSao Tome and PrincipeSenegalSerbiaSeychellesSierra LeoneSingaporeSlovak RepublicSloveniaSolomon IslandsSouth AfricaSpainSri LankaSt. Kitts and NevisSt. LuciaSt. Vincent and the GrenadinesSurinameSwazilandSwedenSwitzerlandSyrian Arab RepublicTajikistanTanzaniaThailandTimor-LesteTogoTrinidad and TobagoTunisiaTurkeyUgandaUkraineUnited Arab EmiratesUnited KingdomUnited StatesUruguayVanuatuVenezuela, RBVietnamWest Bank and GazaYemen, Rep.ZambiaZimbabwe Timeline:
This timeline shows a graph from 1973 to 2012 of Morocco. No data until 1972. Number of actual observations by date: 37.
Source name:
World Development Indicators
Source organization:
International Monetary Fund, Government Finance Statistics Yearbook and data files.
Categories, topics:
Public Sector
Last updated:
apr 23, 2017
Indicators value changes by year
Minimum:
607.0 mln
jan 1, 1973
Maximum:
41.313 bln
jan 1, 2010
At the date of observation
Value
Absolute change
Change from previous value
jan 1, 1973
607.0 mln
+607.0 mln
0.0%
jan 1, 1974
845.0 mln
+238.0 mln
39.21%
jan 1, 1975
2.905 bln
+2.06 bln
243.79%
jan 1, 1976
1.811 bln
-1.094 bln
-37.66%
jan 1, 1977
1.901 bln
+90.0 mln
4.97%
jan 1, 1978
1.716 bln
-185.0 mln
-9.73%
jan 1, 1979
1.793 bln
+77.0 mln
4.49%
jan 1, 1980
2.355 bln
+562.0 mln
31.34%
jan 1, 1981
2.151 bln
-204.0 mln
-8.66%
jan 1, 1982
3.351 bln
+1.2 bln
55.79%
jan 1, 1983
4.534 bln
+1.183 bln
35.3%
jan 1, 1984
3.658 bln
-876.0 mln
-19.32%
jan 1, 1985
3.45 bln
-208.0 mln
-5.69%
jan 1, 1986
4.418 bln
+968.0 mln
28.06%
jan 1, 1987
2.683 bln
-1.735 bln
-39.27%
jan 1, 1988
3.756 bln
+1.073 bln
39.99%
jan 1, 1989
5.655 bln
+1.899 bln
50.56%
jan 1, 1990
5.711 bln
+56.0 mln
0.99%
jan 1, 1991
5.926 bln
+215.0 mln
3.76%
jan 1, 1992
5.925 bln
-1000.0K
-0.02%
jan 1, 1993
6.212 bln
+287.0 mln
4.84%
jan 1, 1994
10.53 bln
+4.318 bln
69.51%
jan 1, 1995
10.211 bln
-319.0 mln
-3.03%
jan 1, 1996
10.177 bln
-34.0 mln
-0.33%
jan 1, 1998
9.972 bln
-205.0 mln
-2.01%
jan 1, 1999
10.099 bln
+127.0 mln
1.27%
jan 1, 2000
12.356 bln
+2.257 bln
22.35%
jan 1, 2003
24.679 bln
+12.323 bln
99.73%
jan 1, 2004
21.858 bln
-2.821 bln
-11.43%
jan 1, 2005
26.327 bln
+4.468 bln
20.44%
jan 1, 2006
25.64 bln
-686.981 mln
-2.61%
jan 1, 2007
30.358 bln
+4.718 bln
18.4%
jan 1, 2008
33.18 bln
+2.822 bln
9.3%
jan 1, 2009
36.365 bln
+3.185 bln
9.6%
jan 1, 2010
41.313 bln
+4.948 bln
13.61%
jan 1, 2011
34.578 bln
-6.735 bln
-16.3%
jan 1, 2012
35.191 bln
+613.452 mln
1.77%
Ranking of countries by current statistics by years


Comments: