29
/
en
AIzaSyAYiBZKx7MnpbEhh9jyipgxe19OcubqV5w
April 1, 2024
176430
Lebanon
LBN
true
2
1
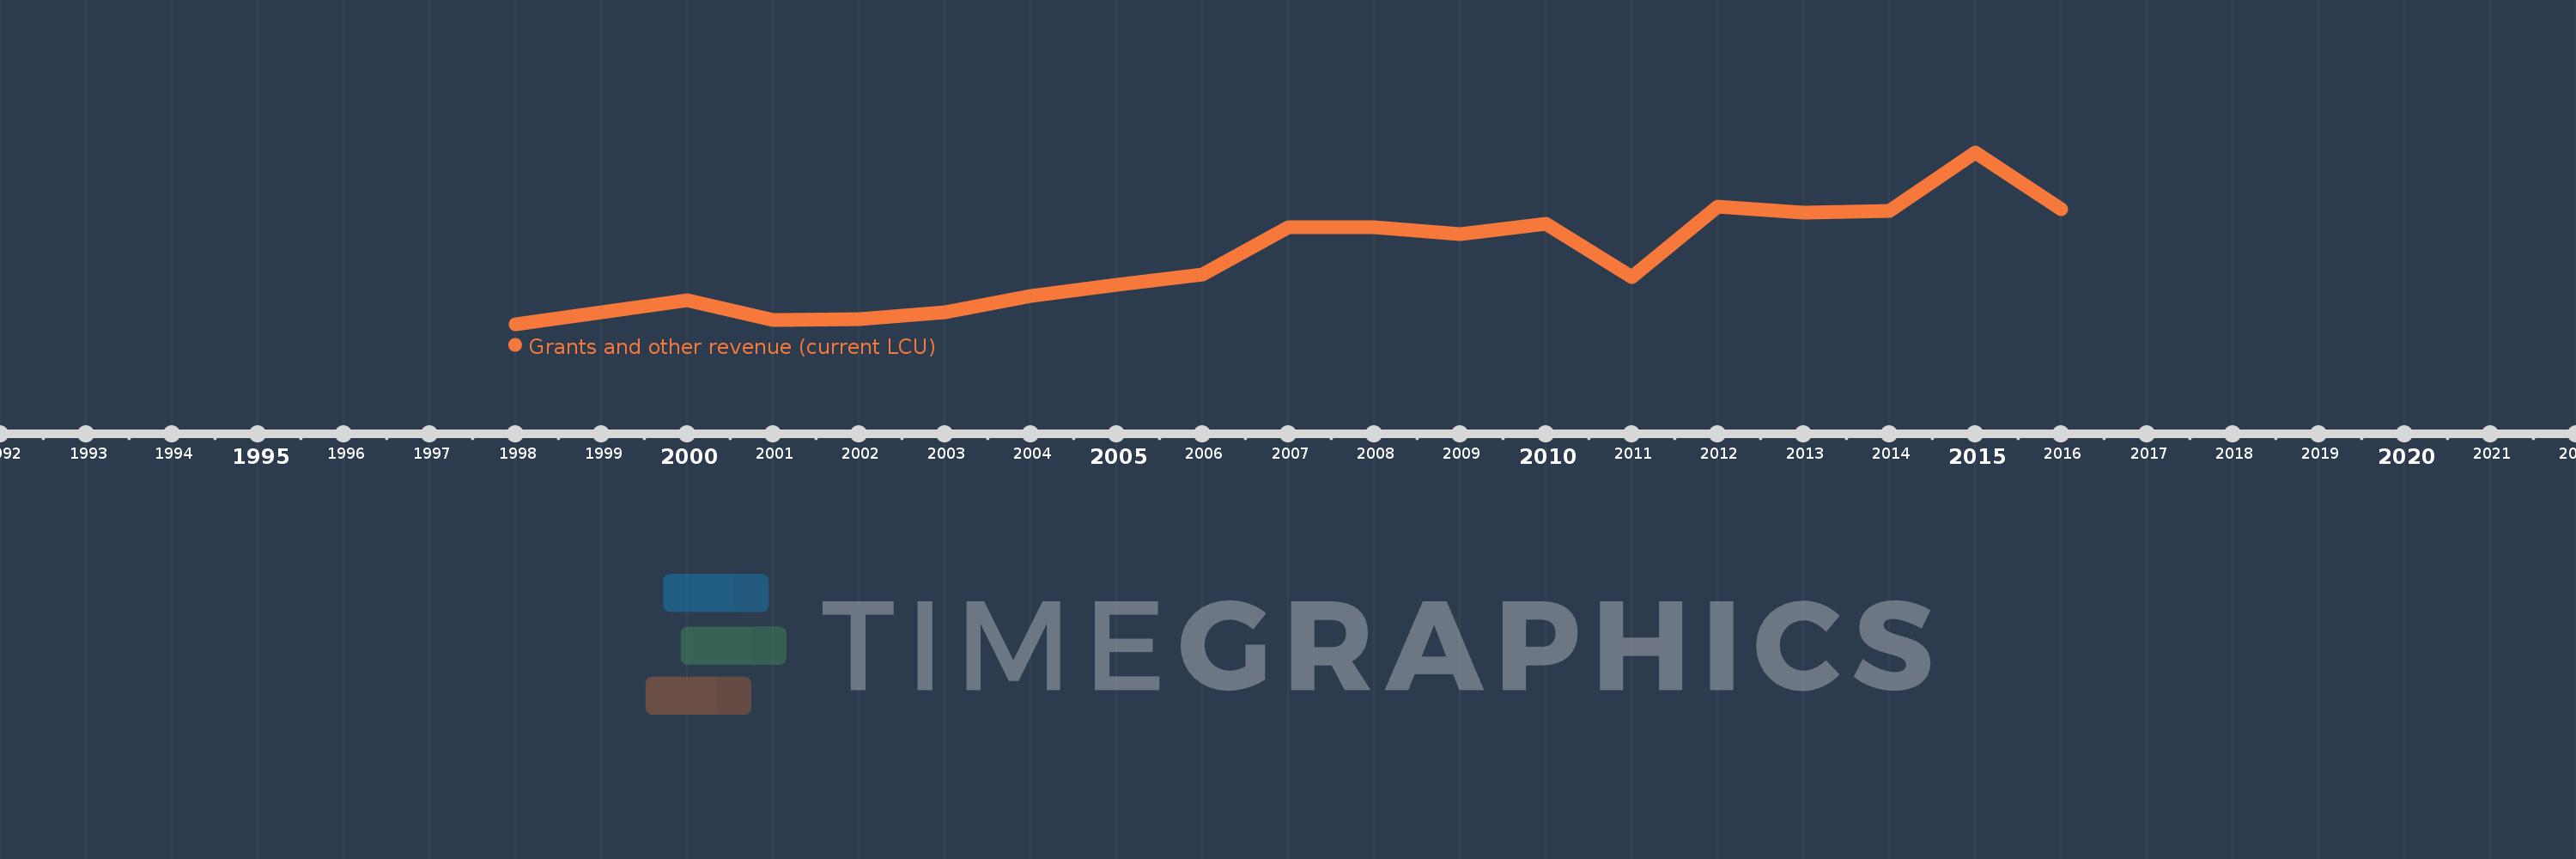
Grants and other revenue (current LCU)
2016,2015,2014,2013,2012,2011,2010,2009,2008,2007,2006,2005,2004,2003,2002,2001,2000,1999,1998
This statistics in other country:
AfghanistanAlbaniaAlgeriaAngolaAntigua and BarbudaArgentinaArmeniaAustraliaAustriaAzerbaijanBahamas, TheBahrainBangladeshBarbadosBelarusBelgiumBelizeBeninBhutanBoliviaBosnia and HerzegovinaBotswanaBrazilBulgariaBurkina FasoBurundiCabo VerdeCambodiaCanadaCentral African RepublicChileChinaColombiaCongo, Dem. Rep.Congo, Rep.Costa RicaCote d'IvoireCroatiaCyprusCzech RepublicDenmarkDominicaDominican RepublicEgypt, Arab Rep.El SalvadorEquatorial GuineaEstoniaEthiopiaFijiFinlandFranceGambia, TheGeorgiaGermanyGhanaGreeceGrenadaGuatemalaHondurasHong Kong SAR, ChinaHungaryIcelandIndiaIndonesiaIran, Islamic Rep.IraqIrelandIsraelItalyJamaicaJapanJordanKazakhstanKenyaKiribatiKorea, Rep.KuwaitKyrgyz RepublicLao PDRLatviaLebanonLesothoLiberiaLithuaniaLuxembourgMacao SAR, ChinaMacedonia, FYRMadagascarMalawiMalaysiaMaldivesMaliMaltaMauritiusMexicoMicronesia, Fed. Sts.MoldovaMongoliaMoroccoMozambiqueMyanmarNamibiaNepalNetherlandsNew ZealandNicaraguaNigeriaNorwayOmanPakistanPanamaPapua New GuineaParaguayPeruPhilippinesPolandPortugalQatarRomaniaRussian FederationRwandaSamoaSan MarinoSao Tome and PrincipeSenegalSerbiaSeychellesSierra LeoneSingaporeSlovak RepublicSloveniaSolomon IslandsSouth AfricaSpainSri LankaSt. Kitts and NevisSt. LuciaSt. Vincent and the GrenadinesSurinameSwazilandSwedenSwitzerlandSyrian Arab RepublicTajikistanTanzaniaThailandTimor-LesteTogoTrinidad and TobagoTunisiaTurkeyUgandaUkraineUnited Arab EmiratesUnited KingdomUnited StatesUruguayVanuatuVenezuela, RBVietnamWest Bank and GazaYemen, Rep.ZambiaZimbabwe Timeline:
This timeline shows a graph from 1998 to 2016 of Lebanon. No data until 1997. Number of actual observations by date: 19.
Source name:
World Development Indicators
Source organization:
International Monetary Fund, Government Finance Statistics Yearbook and data files.
Categories, topics:
Public Sector
Last updated:
apr 23, 2017
Indicators value changes by year
Minimum:
927.175 bln
jan 1, 1998
Maximum:
4.101 trl
jan 1, 2015
At the date of observation
Value
Absolute change
Change from previous value
jan 1, 1998
927.175 bln
+927.175 bln
0.0%
jan 1, 1999
1.141 trl
+213.915 bln
23.07%
jan 1, 2000
1.364 trl
+222.79 bln
19.52%
jan 1, 2001
997.7 bln
-366.18 bln
-26.85%
jan 1, 2002
1.025 trl
+27.4 bln
2.75%
jan 1, 2003
1.144 trl
+119.3 bln
11.64%
jan 1, 2004
1.453 trl
+308.3 bln
26.94%
jan 1, 2005
1.649 trl
+196.0 bln
13.49%
jan 1, 2006
1.853 trl
+204.081 bln
12.38%
jan 1, 2007
2.711 trl
+858.492 bln
46.34%
jan 1, 2008
2.719 trl
+7.997 bln
0.29%
jan 1, 2009
2.595 trl
-124.37 bln
-4.57%
jan 1, 2010
2.786 trl
+191.483 bln
7.38%
jan 1, 2011
1.799 trl
-986.913 bln
-35.42%
jan 1, 2012
3.1 trl
+1.3 trl
72.25%
jan 1, 2013
2.995 trl
-104.977 bln
-3.39%
jan 1, 2014
3.017 trl
+22.366 bln
0.75%
jan 1, 2015
4.101 trl
+1.084 trl
35.93%
jan 1, 2016
3.056 trl
-1.044 trl
-25.47%
Ranking of countries by current statistics by years


Comments: