29
/
en
AIzaSyAYiBZKx7MnpbEhh9jyipgxe19OcubqV5w
April 1, 2024
195591
Mexico
MEX
true
2
1
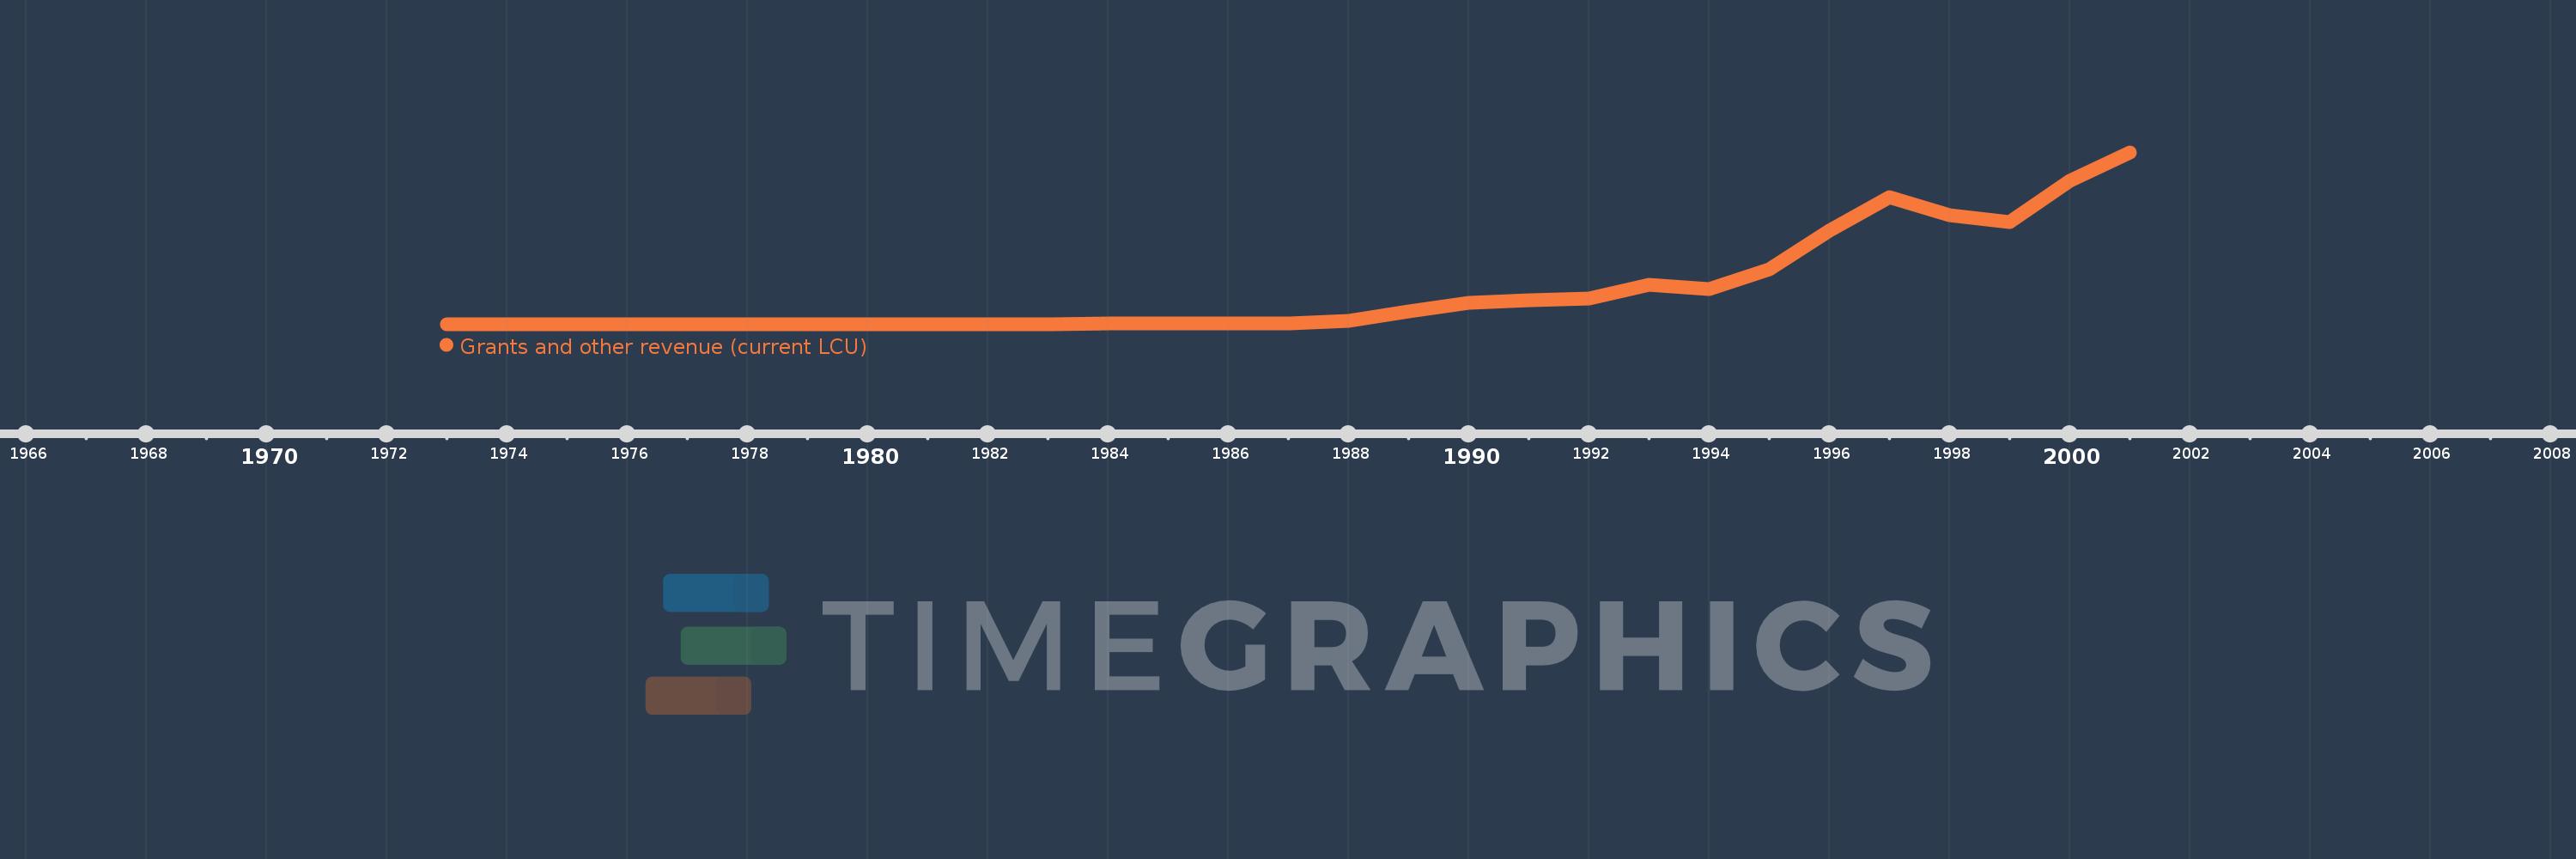
Grants and other revenue (current LCU)
2001,2000,1999,1998,1997,1996,1995,1994,1993,1992,1991,1990,1989,1988,1987,1986,1985,1984,1983,1982,1981,1980,1979,1978,1977,1976,1975,1974,1973
This statistics in other country:
AfghanistanAlbaniaAlgeriaAngolaAntigua and BarbudaArgentinaArmeniaAustraliaAustriaAzerbaijanBahamas, TheBahrainBangladeshBarbadosBelarusBelgiumBelizeBeninBhutanBoliviaBosnia and HerzegovinaBotswanaBrazilBulgariaBurkina FasoBurundiCabo VerdeCambodiaCanadaCentral African RepublicChileChinaColombiaCongo, Dem. Rep.Congo, Rep.Costa RicaCote d'IvoireCroatiaCyprusCzech RepublicDenmarkDominicaDominican RepublicEgypt, Arab Rep.El SalvadorEquatorial GuineaEstoniaEthiopiaFijiFinlandFranceGambia, TheGeorgiaGermanyGhanaGreeceGrenadaGuatemalaHondurasHong Kong SAR, ChinaHungaryIcelandIndiaIndonesiaIran, Islamic Rep.IraqIrelandIsraelItalyJamaicaJapanJordanKazakhstanKenyaKiribatiKorea, Rep.KuwaitKyrgyz RepublicLao PDRLatviaLebanonLesothoLiberiaLithuaniaLuxembourgMacao SAR, ChinaMacedonia, FYRMadagascarMalawiMalaysiaMaldivesMaliMaltaMauritiusMexicoMicronesia, Fed. Sts.MoldovaMongoliaMoroccoMozambiqueMyanmarNamibiaNepalNetherlandsNew ZealandNicaraguaNigeriaNorwayOmanPakistanPanamaPapua New GuineaParaguayPeruPhilippinesPolandPortugalQatarRomaniaRussian FederationRwandaSamoaSan MarinoSao Tome and PrincipeSenegalSerbiaSeychellesSierra LeoneSingaporeSlovak RepublicSloveniaSolomon IslandsSouth AfricaSpainSri LankaSt. Kitts and NevisSt. LuciaSt. Vincent and the GrenadinesSurinameSwazilandSwedenSwitzerlandSyrian Arab RepublicTajikistanTanzaniaThailandTimor-LesteTogoTrinidad and TobagoTunisiaTurkeyUgandaUkraineUnited Arab EmiratesUnited KingdomUnited StatesUruguayVanuatuVenezuela, RBVietnamWest Bank and GazaYemen, Rep.ZambiaZimbabwe Timeline:
This timeline shows a graph from 1973 to 2001 of Mexico. No data until 1972. Number of actual observations by date: 29.
Source name:
World Development Indicators
Source organization:
International Monetary Fund, Government Finance Statistics Yearbook and data files.
Categories, topics:
Public Sector
Last updated:
apr 23, 2017
Indicators value changes by year
Minimum:
4.0 mln
jan 1, 1973
Maximum:
84.912 bln
jan 1, 2001
At the date of observation
Value
Absolute change
Change from previous value
jan 1, 1973
4.0 mln
+4.0 mln
0.0%
jan 1, 1974
6.0 mln
+2.0 mln
50.0%
jan 1, 1975
5.0 mln
-1000.0K
-16.67%
jan 1, 1976
9.0 mln
+4.0 mln
80.0%
jan 1, 1977
14.0 mln
+5.0 mln
55.56%
jan 1, 1978
13.0 mln
-1000.0K
-7.14%
jan 1, 1979
16.0 mln
+3.0 mln
23.08%
jan 1, 1980
20.0 mln
+4.0 mln
25.0%
jan 1, 1981
50.0 mln
+30.0 mln
150.0%
jan 1, 1982
73.0 mln
+23.0 mln
46.0%
jan 1, 1983
152.0 mln
+79.0 mln
108.22%
jan 1, 1984
226.0 mln
+74.0 mln
48.68%
jan 1, 1985
285.0 mln
+59.0 mln
26.11%
jan 1, 1986
349.0 mln
+64.0 mln
22.46%
jan 1, 1987
576.0 mln
+227.0 mln
65.04%
jan 1, 1988
1.709 bln
+1.133 bln
196.7%
jan 1, 1989
6.262 bln
+4.553 bln
266.41%
jan 1, 1990
10.626 bln
+4.364 bln
69.69%
jan 1, 1991
12.0 bln
+1.374 bln
12.93%
jan 1, 1992
12.843 bln
+843.0 mln
7.02%
jan 1, 1993
19.323 bln
+6.48 bln
50.46%
jan 1, 1994
17.228 bln
-2.095 bln
-10.84%
jan 1, 1995
27.301 bln
+10.073 bln
58.47%
jan 1, 1996
46.04 bln
+18.739 bln
68.64%
jan 1, 1997
62.873 bln
+16.833 bln
36.56%
jan 1, 1998
53.782 bln
-9.091 bln
-14.46%
jan 1, 1999
50.678 bln
-3.104 bln
-5.77%
jan 1, 2000
71.067 bln
+20.389 bln
40.23%
jan 1, 2001
84.912 bln
+13.845 bln
19.48%
Ranking of countries by current statistics by years


Comments: