29
/
en
AIzaSyAYiBZKx7MnpbEhh9jyipgxe19OcubqV5w
April 1, 2024
113626
Cote d'Ivoire
CIV
true
2
1
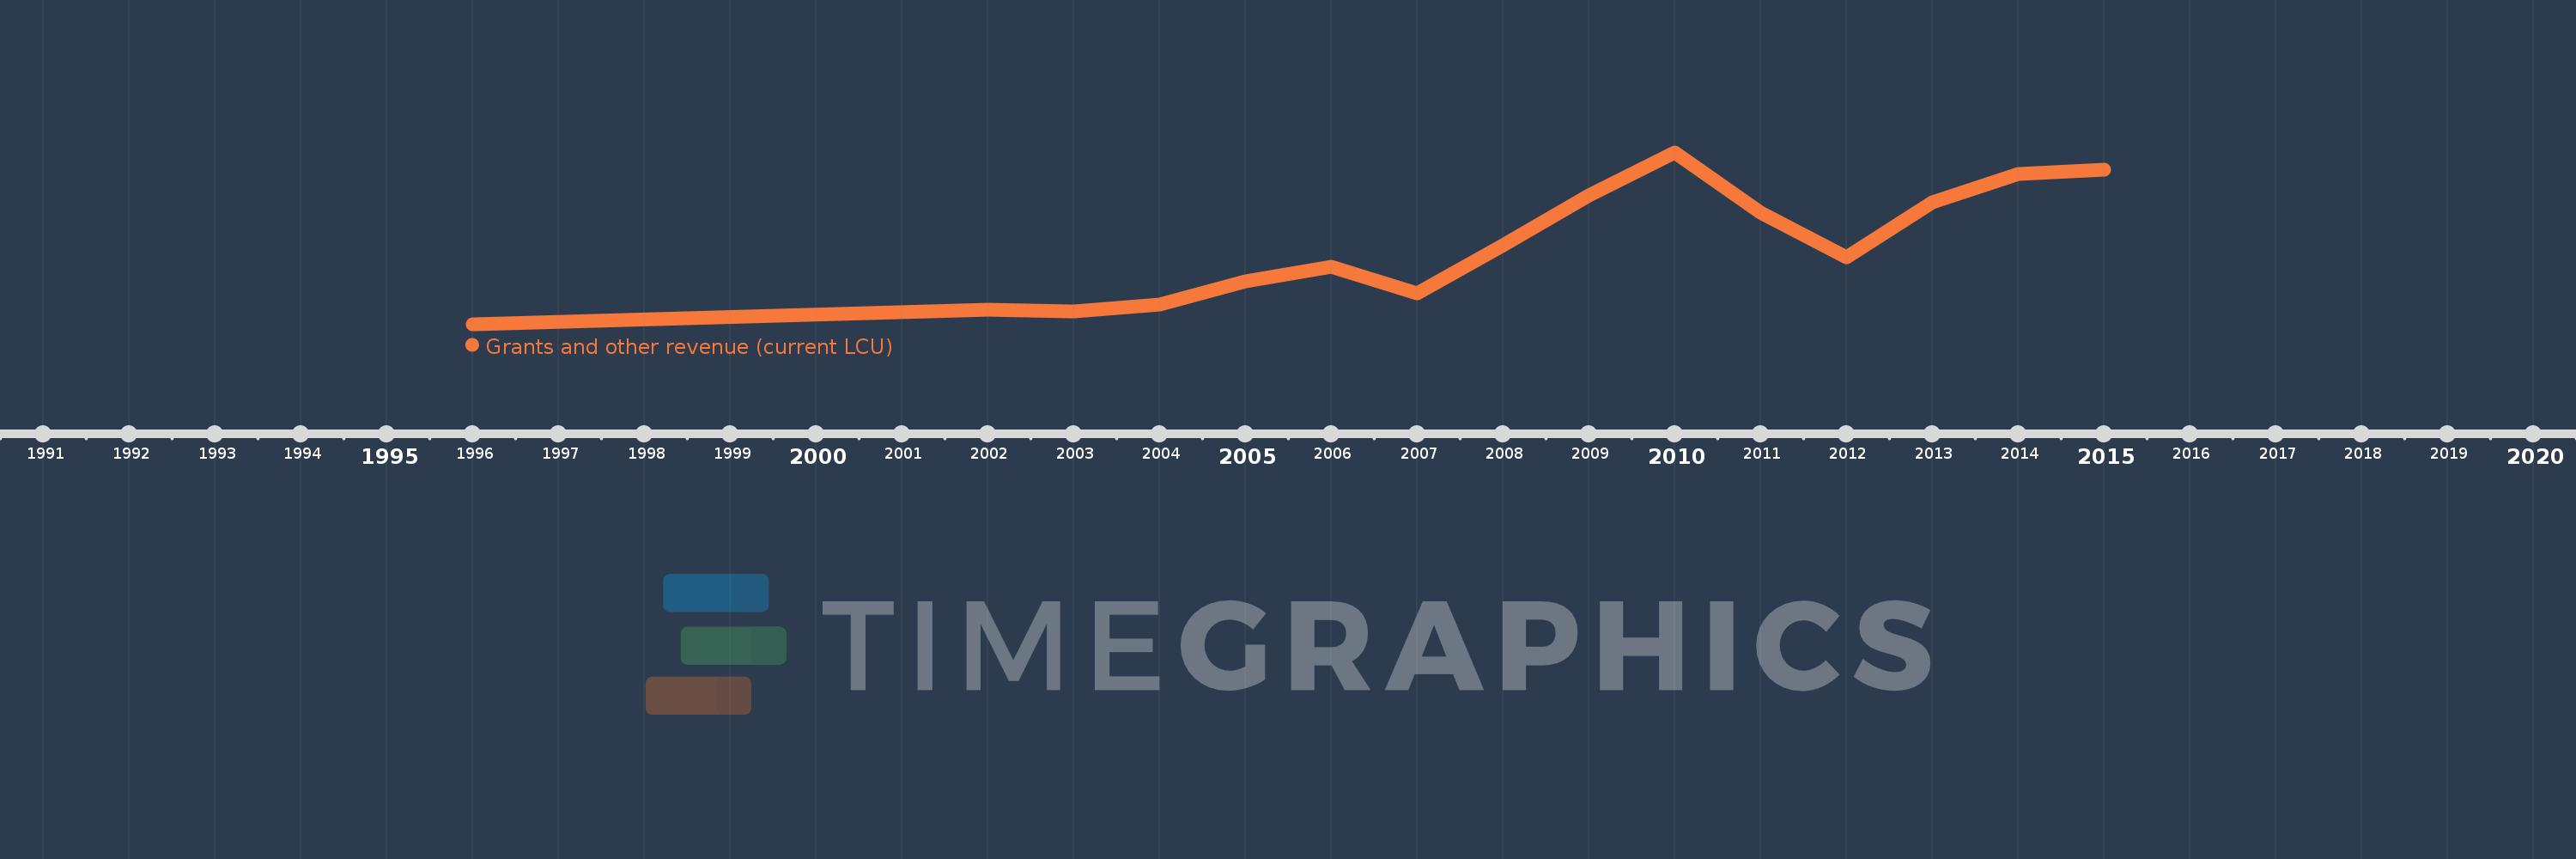
Grants and other revenue (current LCU)
2015,2014,2013,2012,2011,2010,2009,2008,2007,2006,2005,2004,2003,2002,1996
This statistics in other country:
AfghanistanAlbaniaAlgeriaAngolaAntigua and BarbudaArgentinaArmeniaAustraliaAustriaAzerbaijanBahamas, TheBahrainBangladeshBarbadosBelarusBelgiumBelizeBeninBhutanBoliviaBosnia and HerzegovinaBotswanaBrazilBulgariaBurkina FasoBurundiCabo VerdeCambodiaCanadaCentral African RepublicChileChinaColombiaCongo, Dem. Rep.Congo, Rep.Costa RicaCote d'IvoireCroatiaCyprusCzech RepublicDenmarkDominicaDominican RepublicEgypt, Arab Rep.El SalvadorEquatorial GuineaEstoniaEthiopiaFijiFinlandFranceGambia, TheGeorgiaGermanyGhanaGreeceGrenadaGuatemalaHondurasHong Kong SAR, ChinaHungaryIcelandIndiaIndonesiaIran, Islamic Rep.IraqIrelandIsraelItalyJamaicaJapanJordanKazakhstanKenyaKiribatiKorea, Rep.KuwaitKyrgyz RepublicLao PDRLatviaLebanonLesothoLiberiaLithuaniaLuxembourgMacao SAR, ChinaMacedonia, FYRMadagascarMalawiMalaysiaMaldivesMaliMaltaMauritiusMexicoMicronesia, Fed. Sts.MoldovaMongoliaMoroccoMozambiqueMyanmarNamibiaNepalNetherlandsNew ZealandNicaraguaNigeriaNorwayOmanPakistanPanamaPapua New GuineaParaguayPeruPhilippinesPolandPortugalQatarRomaniaRussian FederationRwandaSamoaSan MarinoSao Tome and PrincipeSenegalSerbiaSeychellesSierra LeoneSingaporeSlovak RepublicSloveniaSolomon IslandsSouth AfricaSpainSri LankaSt. Kitts and NevisSt. LuciaSt. Vincent and the GrenadinesSurinameSwazilandSwedenSwitzerlandSyrian Arab RepublicTajikistanTanzaniaThailandTimor-LesteTogoTrinidad and TobagoTunisiaTurkeyUgandaUkraineUnited Arab EmiratesUnited KingdomUnited StatesUruguayVanuatuVenezuela, RBVietnamWest Bank and GazaYemen, Rep.ZambiaZimbabwe Timeline:
This timeline shows a graph from 1996 to 2015 of Cote d'Ivoire. No data until 1995. Number of actual observations by date: 15.
Source name:
World Development Indicators
Source organization:
International Monetary Fund, Government Finance Statistics Yearbook and data files.
Categories, topics:
Public Sector
Last updated:
apr 23, 2017
Indicators value changes by year
Minimum:
52.8 bln
jan 1, 1996
Maximum:
483.967 bln
jan 1, 2010
At the date of observation
Value
Absolute change
Change from previous value
jan 1, 1996
52.8 bln
+52.8 bln
0.0%
jan 1, 2002
88.336 bln
+35.536 bln
67.3%
jan 1, 2003
84.4 bln
-3.936 bln
-4.46%
jan 1, 2004
102.3 bln
+17.9 bln
21.21%
jan 1, 2005
159.3 bln
+57.0 bln
55.72%
jan 1, 2006
198.0 bln
+38.7 bln
24.29%
jan 1, 2007
129.2 bln
-68.8 bln
-34.75%
jan 1, 2008
250.0 bln
+120.8 bln
93.5%
jan 1, 2009
376.9 bln
+126.9 bln
50.76%
jan 1, 2010
483.967 bln
+107.067 bln
28.41%
jan 1, 2011
333.777 bln
-150.19 bln
-31.03%
jan 1, 2012
221.176 bln
-112.601 bln
-33.74%
jan 1, 2013
357.678 bln
+136.502 bln
61.72%
jan 1, 2014
428.927 bln
+71.249 bln
19.92%
jan 1, 2015
441.503 bln
+12.576 bln
2.93%
Ranking of countries by current statistics by years


Comments: