29
/
en
AIzaSyAYiBZKx7MnpbEhh9jyipgxe19OcubqV5w
April 1, 2024
209356
New Zealand
NZL
true
2
1
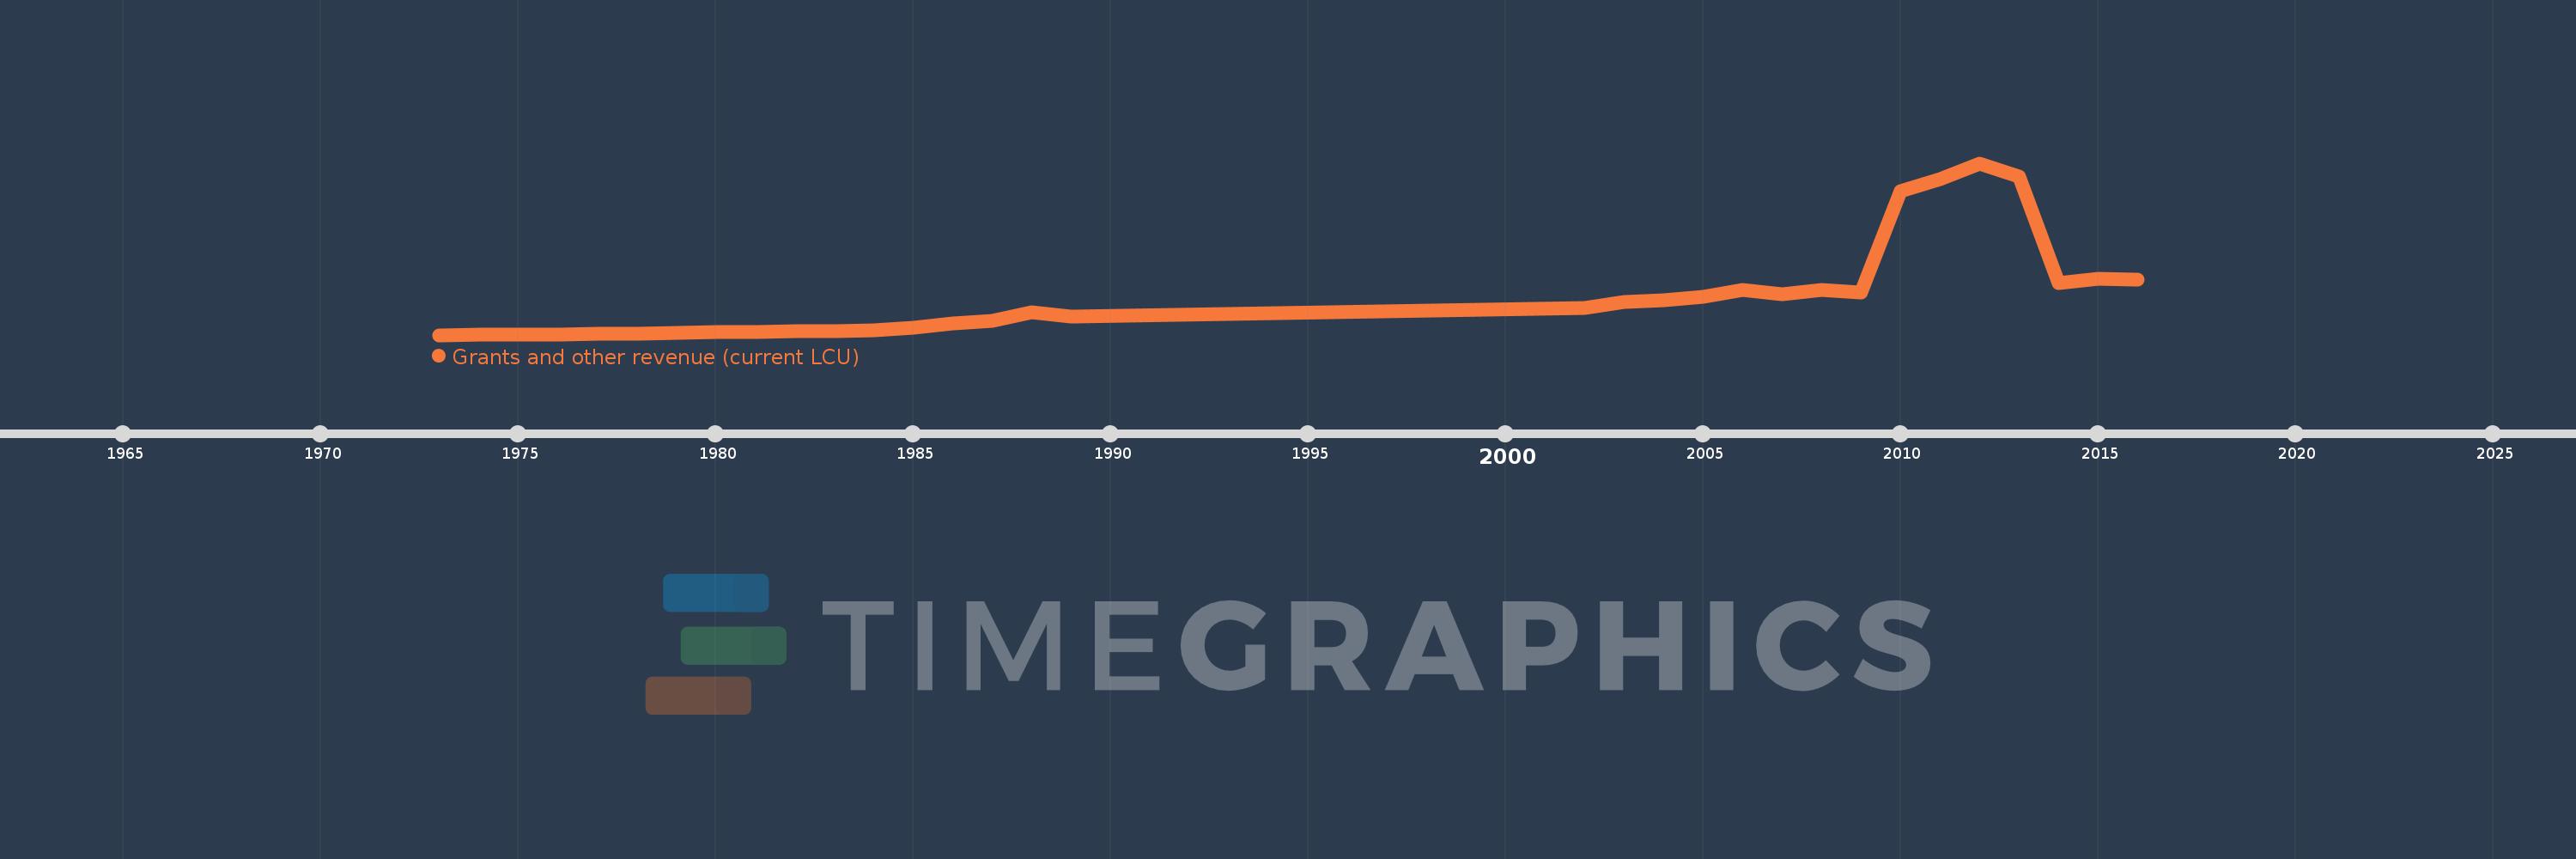
Grants and other revenue (current LCU)
2016,2015,2014,2013,2012,2011,2010,2009,2008,2007,2006,2005,2004,2003,2002,1989,1988,1987,1986,1985,1984,1983,1982,1981,1980,1979,1978,1977,1976,1975,1974,1973
This statistics in other country:
AfghanistanAlbaniaAlgeriaAngolaAntigua and BarbudaArgentinaArmeniaAustraliaAustriaAzerbaijanBahamas, TheBahrainBangladeshBarbadosBelarusBelgiumBelizeBeninBhutanBoliviaBosnia and HerzegovinaBotswanaBrazilBulgariaBurkina FasoBurundiCabo VerdeCambodiaCanadaCentral African RepublicChileChinaColombiaCongo, Dem. Rep.Congo, Rep.Costa RicaCote d'IvoireCroatiaCyprusCzech RepublicDenmarkDominicaDominican RepublicEgypt, Arab Rep.El SalvadorEquatorial GuineaEstoniaEthiopiaFijiFinlandFranceGambia, TheGeorgiaGermanyGhanaGreeceGrenadaGuatemalaHondurasHong Kong SAR, ChinaHungaryIcelandIndiaIndonesiaIran, Islamic Rep.IraqIrelandIsraelItalyJamaicaJapanJordanKazakhstanKenyaKiribatiKorea, Rep.KuwaitKyrgyz RepublicLao PDRLatviaLebanonLesothoLiberiaLithuaniaLuxembourgMacao SAR, ChinaMacedonia, FYRMadagascarMalawiMalaysiaMaldivesMaliMaltaMauritiusMexicoMicronesia, Fed. Sts.MoldovaMongoliaMoroccoMozambiqueMyanmarNamibiaNepalNetherlandsNew ZealandNicaraguaNigeriaNorwayOmanPakistanPanamaPapua New GuineaParaguayPeruPhilippinesPolandPortugalQatarRomaniaRussian FederationRwandaSamoaSan MarinoSao Tome and PrincipeSenegalSerbiaSeychellesSierra LeoneSingaporeSlovak RepublicSloveniaSolomon IslandsSouth AfricaSpainSri LankaSt. Kitts and NevisSt. LuciaSt. Vincent and the GrenadinesSurinameSwazilandSwedenSwitzerlandSyrian Arab RepublicTajikistanTanzaniaThailandTimor-LesteTogoTrinidad and TobagoTunisiaTurkeyUgandaUkraineUnited Arab EmiratesUnited KingdomUnited StatesUruguayVanuatuVenezuela, RBVietnamWest Bank and GazaYemen, Rep.ZambiaZimbabwe Timeline:
This timeline shows a graph from 1973 to 2016 of New Zealand. No data until 1972. Number of actual observations by date: 32.
Source name:
World Development Indicators
Source organization:
International Monetary Fund, Government Finance Statistics Yearbook and data files.
Categories, topics:
Public Sector
Last updated:
apr 23, 2017
Indicators value changes by year
Minimum:
215.0 mln
jan 1, 1973
Maximum:
35.702 bln
jan 1, 2012
At the date of observation
Value
Absolute change
Change from previous value
jan 1, 1973
215.0 mln
+215.0 mln
0.0%
jan 1, 1974
229.0 mln
+14.0 mln
6.51%
jan 1, 1975
254.0 mln
+25.0 mln
10.92%
jan 1, 1976
310.0 mln
+56.0 mln
22.05%
jan 1, 1977
429.0 mln
+119.0 mln
38.39%
jan 1, 1978
519.0 mln
+90.0 mln
20.98%
jan 1, 1979
646.0 mln
+127.0 mln
24.47%
jan 1, 1980
789.0 mln
+143.0 mln
22.14%
jan 1, 1981
808.0 mln
+19.0 mln
2.41%
jan 1, 1982
933.0 mln
+125.0 mln
15.47%
jan 1, 1983
1.082 bln
+149.0 mln
15.97%
jan 1, 1984
1.241 bln
+159.0 mln
14.7%
jan 1, 1985
1.712 bln
+471.0 mln
37.95%
jan 1, 1986
2.564 bln
+852.0 mln
49.77%
jan 1, 1987
3.19 bln
+626.0 mln
24.41%
jan 1, 1988
4.896 bln
+1.706 bln
53.48%
jan 1, 1989
4.048 bln
-848.0 mln
-17.32%
jan 1, 2002
5.853 bln
+1.805 bln
44.59%
jan 1, 2003
7.026 bln
+1.173 bln
20.04%
jan 1, 2004
7.39 bln
+364.473 mln
5.19%
jan 1, 2005
8.087 bln
+696.824 mln
9.43%
jan 1, 2006
9.448 bln
+1.36 bln
16.82%
jan 1, 2007
8.643 bln
-804.535 mln
-8.52%
jan 1, 2008
9.551 bln
+908.0 mln
10.51%
jan 1, 2009
9.059 bln
-492.0 mln
-5.15%
jan 1, 2010
29.857 bln
+20.798 bln
229.58%
jan 1, 2011
32.363 bln
+2.506 bln
8.39%
jan 1, 2012
35.702 bln
+3.339 bln
10.32%
jan 1, 2013
33.035 bln
-2.666 bln
-7.47%
jan 1, 2014
11.02 bln
-22.015 bln
-66.64%
jan 1, 2015
11.758 bln
+738.132 mln
6.7%
jan 1, 2016
11.62 bln
-138.132 mln
-1.17%
Ranking of countries by current statistics by years


Comments: