29
/
en
AIzaSyAYiBZKx7MnpbEhh9jyipgxe19OcubqV5w
April 1, 2024
241638
Slovak Republic
SVK
true
2
1
Grants and other revenue (current LCU)
2015,2014,2013,2012,2011,2010,2009,2008,2007,2006,2005,2004,2003,2002,2001,2000,1999,1998,1997
This statistics in other country:
AfghanistanAlbaniaAlgeriaAngolaAntigua and BarbudaArgentinaArmeniaAustraliaAustriaAzerbaijanBahamas, TheBahrainBangladeshBarbadosBelarusBelgiumBelizeBeninBhutanBoliviaBosnia and HerzegovinaBotswanaBrazilBulgariaBurkina FasoBurundiCabo VerdeCambodiaCanadaCentral African RepublicChileChinaColombiaCongo, Dem. Rep.Congo, Rep.Costa RicaCote d'IvoireCroatiaCyprusCzech RepublicDenmarkDominicaDominican RepublicEgypt, Arab Rep.El SalvadorEquatorial GuineaEstoniaEthiopiaFijiFinlandFranceGambia, TheGeorgiaGermanyGhanaGreeceGrenadaGuatemalaHondurasHong Kong SAR, ChinaHungaryIcelandIndiaIndonesiaIran, Islamic Rep.IraqIrelandIsraelItalyJamaicaJapanJordanKazakhstanKenyaKiribatiKorea, Rep.KuwaitKyrgyz RepublicLao PDRLatviaLebanonLesothoLiberiaLithuaniaLuxembourgMacao SAR, ChinaMacedonia, FYRMadagascarMalawiMalaysiaMaldivesMaliMaltaMauritiusMexicoMicronesia, Fed. Sts.MoldovaMongoliaMoroccoMozambiqueMyanmarNamibiaNepalNetherlandsNew ZealandNicaraguaNigeriaNorwayOmanPakistanPanamaPapua New GuineaParaguayPeruPhilippinesPolandPortugalQatarRomaniaRussian FederationRwandaSamoaSan MarinoSao Tome and PrincipeSenegalSerbiaSeychellesSierra LeoneSingaporeSlovak RepublicSloveniaSolomon IslandsSouth AfricaSpainSri LankaSt. Kitts and NevisSt. LuciaSt. Vincent and the GrenadinesSurinameSwazilandSwedenSwitzerlandSyrian Arab RepublicTajikistanTanzaniaThailandTimor-LesteTogoTrinidad and TobagoTunisiaTurkeyUgandaUkraineUnited Arab EmiratesUnited KingdomUnited StatesUruguayVanuatuVenezuela, RBVietnamWest Bank and GazaYemen, Rep.ZambiaZimbabwe Timeline:
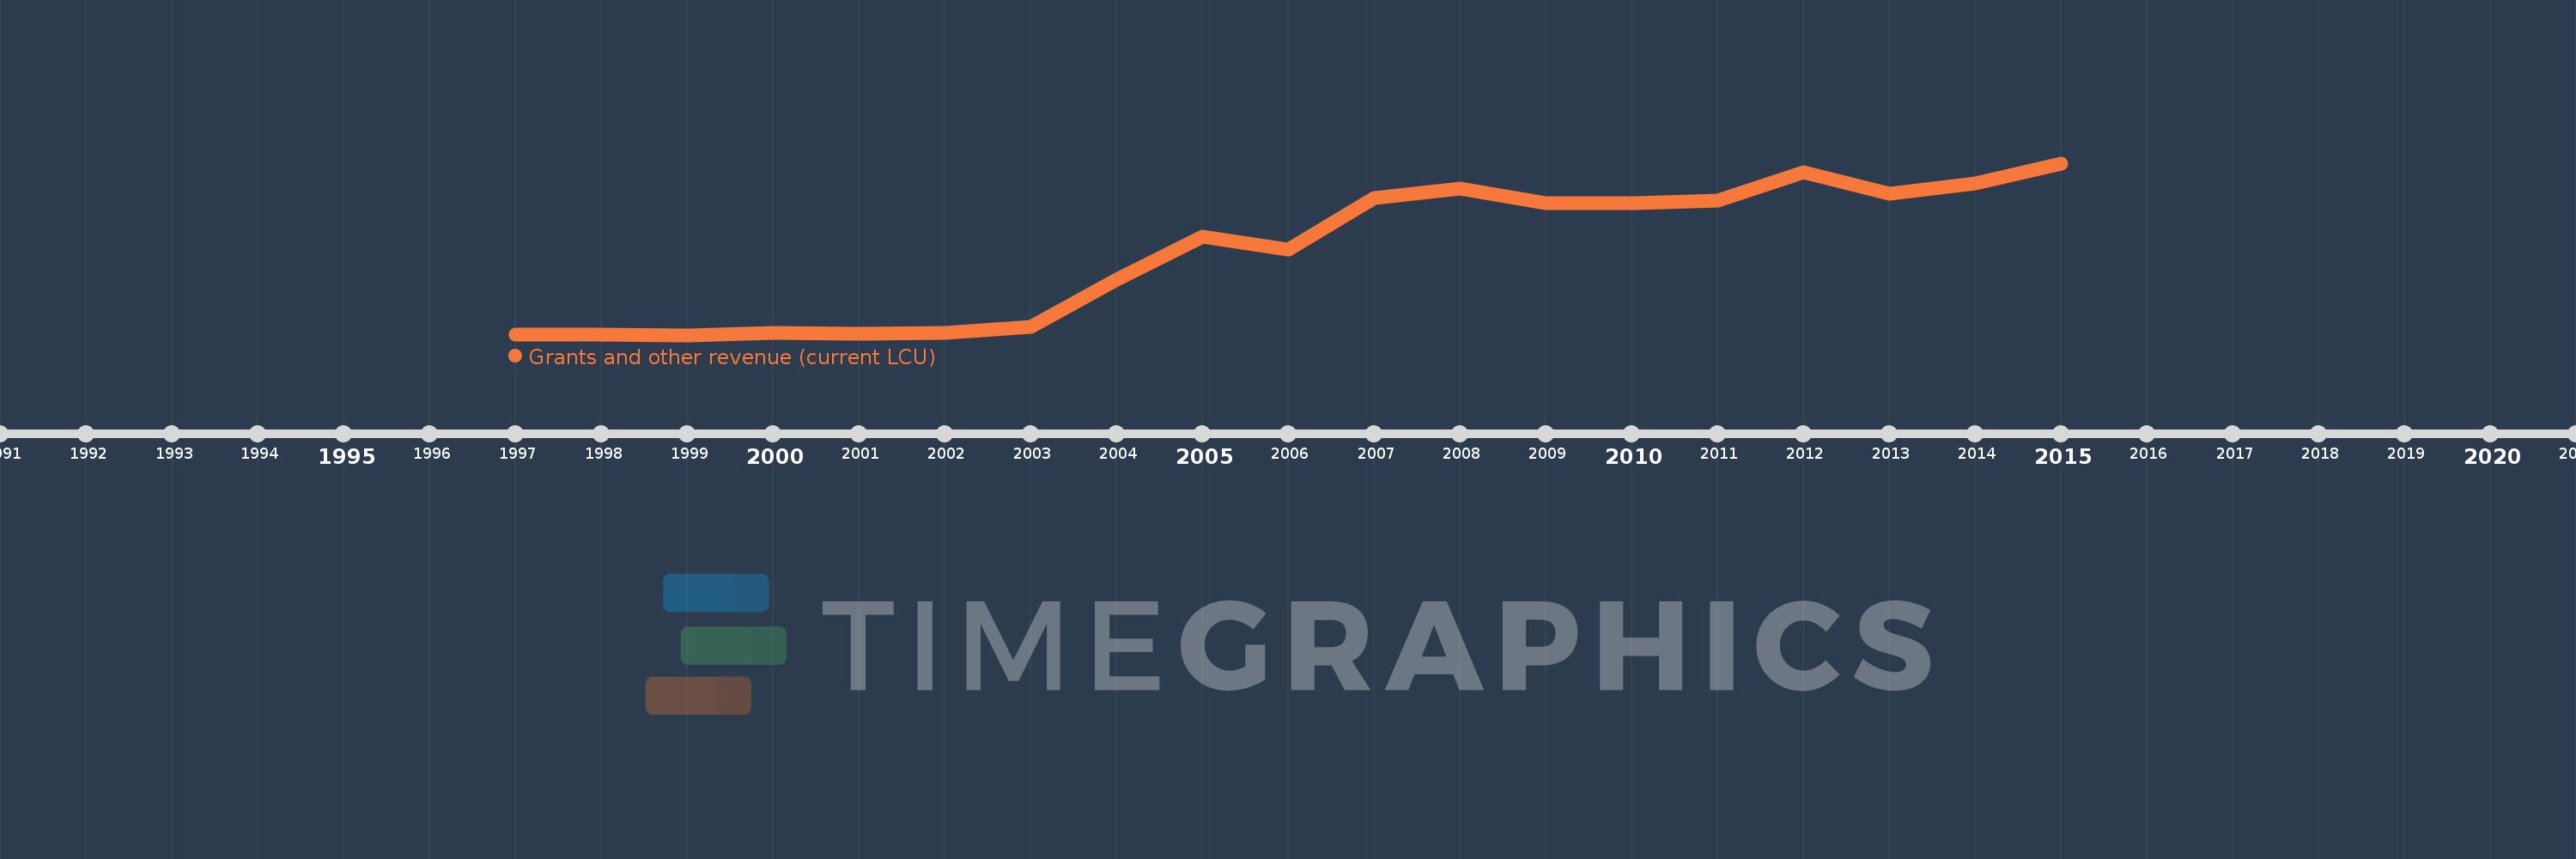
This timeline shows a graph from 1997 to 2015 of Slovak Republic. No data until 1996. Number of actual observations by date: 19.
Source name:
World Development Indicators
Source organization:
International Monetary Fund, Government Finance Statistics Yearbook and data files.
Categories, topics:
Public Sector
Last updated:
apr 23, 2017
Indicators value changes by year
Minimum:
13.091 mln
jan 1, 1999
Maximum:
3.089 bln
jan 1, 2015
At the date of observation
Value
Absolute change
Change from previous value
jan 1, 1997
17.182 mln
+17.182 mln
0.0%
jan 1, 1998
16.039 mln
-1.143 mln
-6.65%
jan 1, 1999
13.091 mln
-2.949 mln
-18.38%
jan 1, 2000
48.216 mln
+35.125 mln
268.32%
jan 1, 2001
41.835 mln
-6.382 mln
-13.24%
jan 1, 2002
43.883 mln
+2.048 mln
4.9%
jan 1, 2003
162.191 mln
+118.309 mln
269.6%
jan 1, 2004
1.011 bln
+848.663 mln
523.25%
jan 1, 2005
1.781 bln
+770.431 mln
76.22%
jan 1, 2006
1.545 bln
-235.942 mln
-13.25%
jan 1, 2007
2.473 bln
+927.372 mln
60.01%
jan 1, 2008
2.632 bln
+159.36 mln
6.44%
jan 1, 2009
2.368 bln
-264.028 mln
-10.03%
jan 1, 2010
2.377 bln
+8.817 mln
0.37%
jan 1, 2011
2.416 bln
+39.525 mln
1.66%
jan 1, 2012
2.927 bln
+510.268 mln
21.12%
jan 1, 2013
2.536 bln
-391.083 mln
-13.36%
jan 1, 2014
2.735 bln
+198.965 mln
7.85%
jan 1, 2015
3.089 bln
+354.594 mln
12.97%
Ranking of countries by current statistics by years


Comments: