29
/
en
AIzaSyAYiBZKx7MnpbEhh9jyipgxe19OcubqV5w
April 1, 2024
215316
Oman
OMN
true
2
1
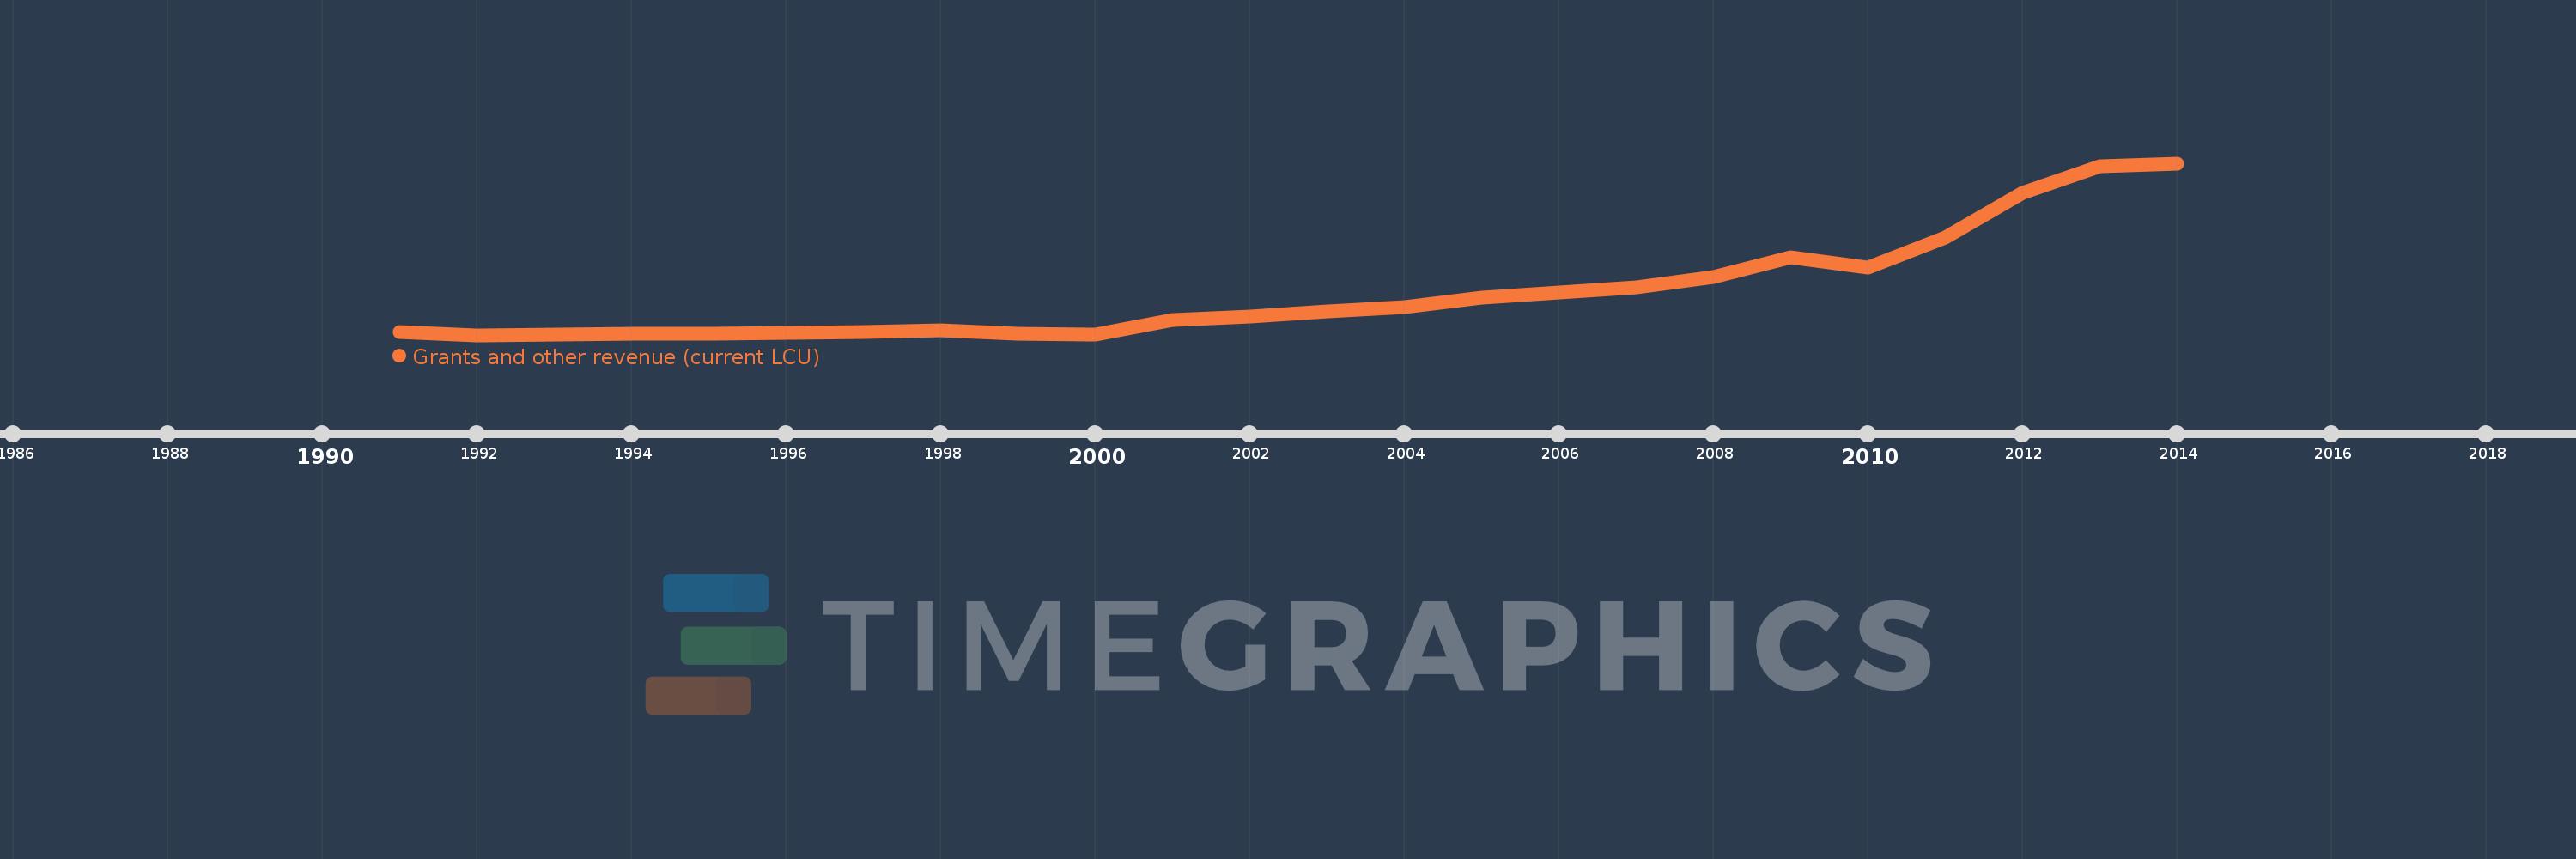
Grants and other revenue (current LCU)
2014,2013,2012,2011,2010,2009,2008,2007,2006,2005,2004,2003,2002,2001,2000,1999,1998,1997,1996,1995,1994,1993,1992,1991
This statistics in other country:
AfghanistanAlbaniaAlgeriaAngolaAntigua and BarbudaArgentinaArmeniaAustraliaAustriaAzerbaijanBahamas, TheBahrainBangladeshBarbadosBelarusBelgiumBelizeBeninBhutanBoliviaBosnia and HerzegovinaBotswanaBrazilBulgariaBurkina FasoBurundiCabo VerdeCambodiaCanadaCentral African RepublicChileChinaColombiaCongo, Dem. Rep.Congo, Rep.Costa RicaCote d'IvoireCroatiaCyprusCzech RepublicDenmarkDominicaDominican RepublicEgypt, Arab Rep.El SalvadorEquatorial GuineaEstoniaEthiopiaFijiFinlandFranceGambia, TheGeorgiaGermanyGhanaGreeceGrenadaGuatemalaHondurasHong Kong SAR, ChinaHungaryIcelandIndiaIndonesiaIran, Islamic Rep.IraqIrelandIsraelItalyJamaicaJapanJordanKazakhstanKenyaKiribatiKorea, Rep.KuwaitKyrgyz RepublicLao PDRLatviaLebanonLesothoLiberiaLithuaniaLuxembourgMacao SAR, ChinaMacedonia, FYRMadagascarMalawiMalaysiaMaldivesMaliMaltaMauritiusMexicoMicronesia, Fed. Sts.MoldovaMongoliaMoroccoMozambiqueMyanmarNamibiaNepalNetherlandsNew ZealandNicaraguaNigeriaNorwayOmanPakistanPanamaPapua New GuineaParaguayPeruPhilippinesPolandPortugalQatarRomaniaRussian FederationRwandaSamoaSan MarinoSao Tome and PrincipeSenegalSerbiaSeychellesSierra LeoneSingaporeSlovak RepublicSloveniaSolomon IslandsSouth AfricaSpainSri LankaSt. Kitts and NevisSt. LuciaSt. Vincent and the GrenadinesSurinameSwazilandSwedenSwitzerlandSyrian Arab RepublicTajikistanTanzaniaThailandTimor-LesteTogoTrinidad and TobagoTunisiaTurkeyUgandaUkraineUnited Arab EmiratesUnited KingdomUnited StatesUruguayVanuatuVenezuela, RBVietnamWest Bank and GazaYemen, Rep.ZambiaZimbabwe Timeline:
This timeline shows a graph from 1991 to 2014 of Oman. No data until 1990. Number of actual observations by date: 24.
Source name:
World Development Indicators
Source organization:
International Monetary Fund, Government Finance Statistics Yearbook and data files.
Categories, topics:
Public Sector
Last updated:
apr 23, 2017
Indicators value changes by year
Minimum:
949.8 mln
jan 1, 1992
Maximum:
14.229 bln
jan 1, 2014
At the date of observation
Value
Absolute change
Change from previous value
jan 1, 1991
1.16 bln
+1.16 bln
0.0%
jan 1, 1992
949.8 mln
-210.0 mln
-18.11%
jan 1, 1993
996.5 mln
+46.7 mln
4.92%
jan 1, 1994
1.074 bln
+77.9 mln
7.82%
jan 1, 1995
1.056 bln
-18.3 mln
-1.7%
jan 1, 1996
1.095 bln
+39.2 mln
3.71%
jan 1, 1997
1.159 bln
+63.8 mln
5.82%
jan 1, 1998
1.344 bln
+184.5 mln
15.92%
jan 1, 1999
1.055 bln
-288.2 mln
-21.45%
jan 1, 2000
996.2 mln
-59.2 mln
-5.61%
jan 1, 2001
2.128 bln
+1.132 bln
113.62%
jan 1, 2002
2.382 bln
+253.9 mln
11.93%
jan 1, 2003
2.8 bln
+417.6 mln
17.53%
jan 1, 2004
3.115 bln
+315.1 mln
11.26%
jan 1, 2005
3.829 bln
+714.4 mln
22.94%
jan 1, 2006
4.205 bln
+376.0 mln
9.82%
jan 1, 2007
4.635 bln
+429.5 mln
10.21%
jan 1, 2008
5.401 bln
+766.4 mln
16.54%
jan 1, 2009
6.971 bln
+1.57 bln
29.06%
jan 1, 2010
6.177 bln
-794.1 mln
-11.39%
jan 1, 2011
8.478 bln
+2.301 bln
37.26%
jan 1, 2012
11.943 bln
+3.465 bln
40.87%
jan 1, 2013
13.999 bln
+2.057 bln
17.22%
jan 1, 2014
14.229 bln
+229.4 mln
1.64%
Ranking of countries by current statistics by years


Comments: