29
/
en
AIzaSyAYiBZKx7MnpbEhh9jyipgxe19OcubqV5w
April 1, 2024
207980
Netherlands
NLD
true
2
1
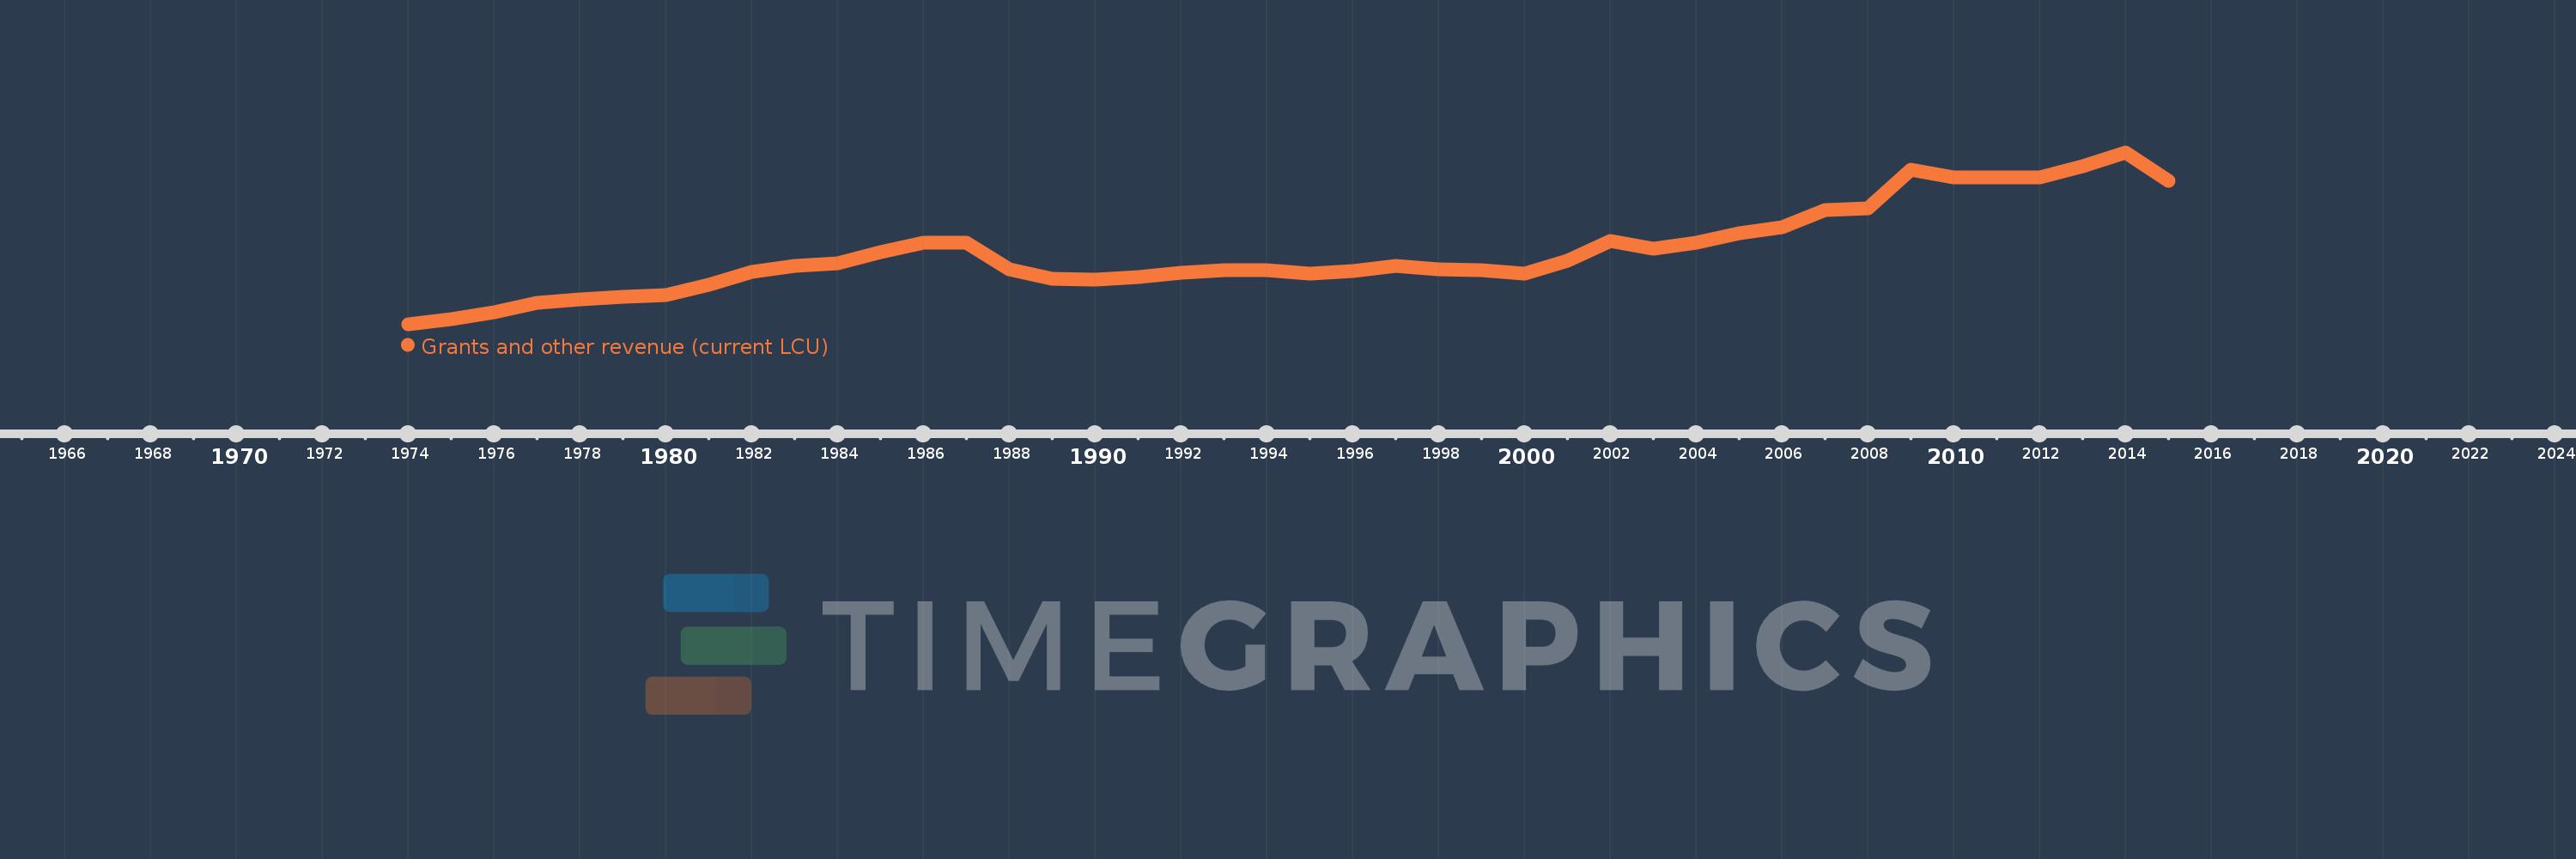
Grants and other revenue (current LCU)
2015,2014,2013,2012,2011,2010,2009,2008,2007,2006,2005,2004,2003,2002,2001,2000,1999,1998,1997,1996,1995,1994,1993,1992,1991,1990,1989,1988,1987,1986,1985,1984,1983,1982,1981,1980,1979,1978,1977,1976,1975,1974
This statistics in other country:
AfghanistanAlbaniaAlgeriaAngolaAntigua and BarbudaArgentinaArmeniaAustraliaAustriaAzerbaijanBahamas, TheBahrainBangladeshBarbadosBelarusBelgiumBelizeBeninBhutanBoliviaBosnia and HerzegovinaBotswanaBrazilBulgariaBurkina FasoBurundiCabo VerdeCambodiaCanadaCentral African RepublicChileChinaColombiaCongo, Dem. Rep.Congo, Rep.Costa RicaCote d'IvoireCroatiaCyprusCzech RepublicDenmarkDominicaDominican RepublicEgypt, Arab Rep.El SalvadorEquatorial GuineaEstoniaEthiopiaFijiFinlandFranceGambia, TheGeorgiaGermanyGhanaGreeceGrenadaGuatemalaHondurasHong Kong SAR, ChinaHungaryIcelandIndiaIndonesiaIran, Islamic Rep.IraqIrelandIsraelItalyJamaicaJapanJordanKazakhstanKenyaKiribatiKorea, Rep.KuwaitKyrgyz RepublicLao PDRLatviaLebanonLesothoLiberiaLithuaniaLuxembourgMacao SAR, ChinaMacedonia, FYRMadagascarMalawiMalaysiaMaldivesMaliMaltaMauritiusMexicoMicronesia, Fed. Sts.MoldovaMongoliaMoroccoMozambiqueMyanmarNamibiaNepalNetherlandsNew ZealandNicaraguaNigeriaNorwayOmanPakistanPanamaPapua New GuineaParaguayPeruPhilippinesPolandPortugalQatarRomaniaRussian FederationRwandaSamoaSan MarinoSao Tome and PrincipeSenegalSerbiaSeychellesSierra LeoneSingaporeSlovak RepublicSloveniaSolomon IslandsSouth AfricaSpainSri LankaSt. Kitts and NevisSt. LuciaSt. Vincent and the GrenadinesSurinameSwazilandSwedenSwitzerlandSyrian Arab RepublicTajikistanTanzaniaThailandTimor-LesteTogoTrinidad and TobagoTunisiaTurkeyUgandaUkraineUnited Arab EmiratesUnited KingdomUnited StatesUruguayVanuatuVenezuela, RBVietnamWest Bank and GazaYemen, Rep.ZambiaZimbabwe Timeline:
This timeline shows a graph from 1974 to 2015 of Netherlands. No data until 1973. Number of actual observations by date: 42.
Source name:
World Development Indicators
Source organization:
International Monetary Fund, Government Finance Statistics Yearbook and data files.
Categories, topics:
Public Sector
Last updated:
apr 23, 2017
Indicators value changes by year
Minimum:
1.779 bln
jan 1, 1974
Maximum:
31.09 bln
jan 1, 2014
At the date of observation
Value
Absolute change
Change from previous value
jan 1, 1974
1.779 bln
+1.779 bln
0.0%
jan 1, 1975
2.714 bln
+934.787 mln
52.55%
jan 1, 1976
3.884 bln
+1.171 bln
43.14%
jan 1, 1977
5.459 bln
+1.575 bln
40.54%
jan 1, 1978
5.999 bln
+539.998 mln
9.89%
jan 1, 1979
6.394 bln
+394.789 mln
6.58%
jan 1, 1980
6.802 bln
+408.402 mln
6.39%
jan 1, 1981
8.472 bln
+1.67 bln
24.55%
jan 1, 1982
10.755 bln
+2.283 bln
26.94%
jan 1, 1983
11.658 bln
+903.023 mln
8.4%
jan 1, 1984
12.134 bln
+476.469 mln
4.09%
jan 1, 1985
14.085 bln
+1.951 bln
16.08%
jan 1, 1986
15.71 bln
+1.625 bln
11.53%
jan 1, 1987
15.692 bln
-18.151 mln
-0.12%
jan 1, 1988
11.19 bln
-4.501 bln
-28.69%
jan 1, 1989
9.525 bln
-1.665 bln
-14.88%
jan 1, 1990
9.416 bln
-108.907 mln
-1.14%
jan 1, 1991
9.897 bln
+481.007 mln
5.11%
jan 1, 1992
10.496 bln
+598.99 mln
6.05%
jan 1, 1993
11.022 bln
+526.385 mln
5.02%
jan 1, 1994
11.022 bln
0.0
0.0%
jan 1, 1995
10.478 bln
-544.536 mln
-4.94%
jan 1, 1996
10.894 bln
+416.215 mln
3.97%
jan 1, 1997
11.803 bln
+909.0 mln
8.34%
jan 1, 1998
11.176 bln
-627.0 mln
-5.31%
jan 1, 1999
10.984 bln
-192.0 mln
-1.72%
jan 1, 2000
10.412 bln
-572.0 mln
-5.21%
jan 1, 2001
12.68 bln
+2.268 bln
21.78%
jan 1, 2002
15.919 bln
+3.239 bln
25.54%
jan 1, 2003
14.653 bln
-1.266 bln
-7.95%
jan 1, 2004
15.63 bln
+977.0 mln
6.67%
jan 1, 2005
17.253 bln
+1.623 bln
10.38%
jan 1, 2006
18.38 bln
+1.127 bln
6.53%
jan 1, 2007
21.314 bln
+2.934 bln
15.96%
jan 1, 2008
21.609 bln
+295.0 mln
1.38%
jan 1, 2009
28.156 bln
+6.547 bln
30.3%
jan 1, 2010
26.79 bln
-1.366 bln
-4.85%
jan 1, 2011
26.788 bln
-2.0 mln
-0.01%
jan 1, 2012
26.855 bln
+67.0 mln
0.25%
jan 1, 2013
28.765 bln
+1.91 bln
7.11%
jan 1, 2014
31.09 bln
+2.325 bln
8.08%
jan 1, 2015
26.183 bln
-4.907 bln
-15.78%
Ranking of countries by current statistics by years


Comments: