29
/
en
AIzaSyAYiBZKx7MnpbEhh9jyipgxe19OcubqV5w
April 1, 2024
277714
Uruguay
URY
true
2
1
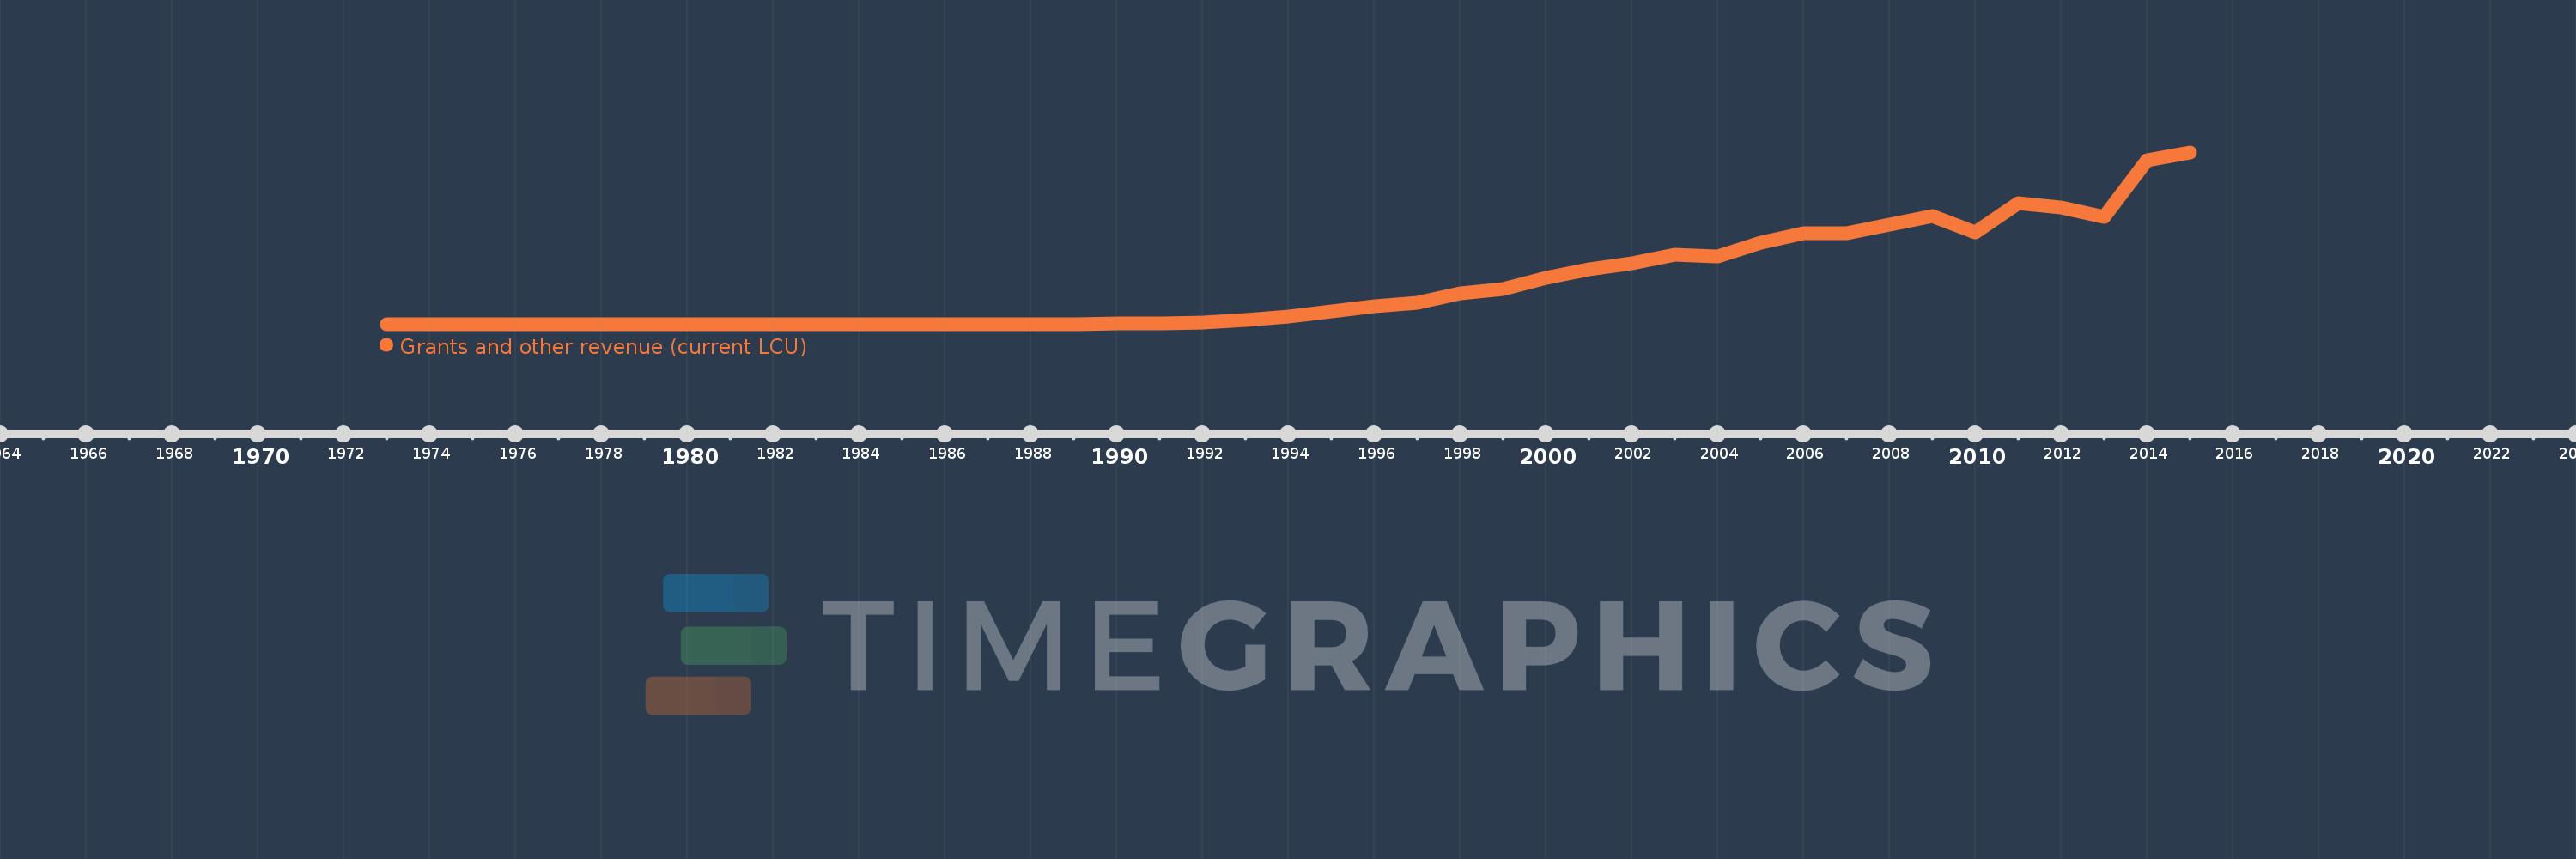
Grants and other revenue (current LCU)
2015,2014,2013,2012,2011,2010,2009,2008,2007,2006,2005,2004,2003,2002,2001,2000,1999,1998,1997,1996,1995,1994,1993,1992,1991,1990,1989,1988,1987,1986,1985,1984,1983,1982,1981,1980,1979,1978,1977,1976,1975,1974,1973
This statistics in other country:
AfghanistanAlbaniaAlgeriaAngolaAntigua and BarbudaArgentinaArmeniaAustraliaAustriaAzerbaijanBahamas, TheBahrainBangladeshBarbadosBelarusBelgiumBelizeBeninBhutanBoliviaBosnia and HerzegovinaBotswanaBrazilBulgariaBurkina FasoBurundiCabo VerdeCambodiaCanadaCentral African RepublicChileChinaColombiaCongo, Dem. Rep.Congo, Rep.Costa RicaCote d'IvoireCroatiaCyprusCzech RepublicDenmarkDominicaDominican RepublicEgypt, Arab Rep.El SalvadorEquatorial GuineaEstoniaEthiopiaFijiFinlandFranceGambia, TheGeorgiaGermanyGhanaGreeceGrenadaGuatemalaHondurasHong Kong SAR, ChinaHungaryIcelandIndiaIndonesiaIran, Islamic Rep.IraqIrelandIsraelItalyJamaicaJapanJordanKazakhstanKenyaKiribatiKorea, Rep.KuwaitKyrgyz RepublicLao PDRLatviaLebanonLesothoLiberiaLithuaniaLuxembourgMacao SAR, ChinaMacedonia, FYRMadagascarMalawiMalaysiaMaldivesMaliMaltaMauritiusMexicoMicronesia, Fed. Sts.MoldovaMongoliaMoroccoMozambiqueMyanmarNamibiaNepalNetherlandsNew ZealandNicaraguaNigeriaNorwayOmanPakistanPanamaPapua New GuineaParaguayPeruPhilippinesPolandPortugalQatarRomaniaRussian FederationRwandaSamoaSan MarinoSao Tome and PrincipeSenegalSerbiaSeychellesSierra LeoneSingaporeSlovak RepublicSloveniaSolomon IslandsSouth AfricaSpainSri LankaSt. Kitts and NevisSt. LuciaSt. Vincent and the GrenadinesSurinameSwazilandSwedenSwitzerlandSyrian Arab RepublicTajikistanTanzaniaThailandTimor-LesteTogoTrinidad and TobagoTunisiaTurkeyUgandaUkraineUnited Arab EmiratesUnited KingdomUnited StatesUruguayVanuatuVenezuela, RBVietnamWest Bank and GazaYemen, Rep.ZambiaZimbabwe Timeline:
This timeline shows a graph from 1973 to 2015 of Uruguay. No data until 1972. Number of actual observations by date: 43.
Source name:
World Development Indicators
Source organization:
International Monetary Fund, Government Finance Statistics Yearbook and data files.
Categories, topics:
Public Sector
Last updated:
apr 23, 2017
Indicators value changes by year
Maximum:
24.523 bln
jan 1, 2015
At the date of observation
Value
Absolute change
Change from previous value
jan 1, 1973
35.0K
+35.0K
0.0%
jan 1, 1974
58.0K
+23.0K
65.71%
jan 1, 1975
53.0K
-5.0K
-8.62%
jan 1, 1976
68.0K
+15.0K
28.3%
jan 1, 1977
76.0K
+8.0K
11.76%
jan 1, 1978
170.0K
+94.0K
123.68%
jan 1, 1979
336.0K
+166.0K
97.65%
jan 1, 1980
599.0K
+263.0K
78.27%
jan 1, 1981
1.136 mln
+537.0K
89.65%
jan 1, 1982
1.958 mln
+822.0K
72.36%
jan 1, 1983
2.403 mln
+445.0K
22.73%
jan 1, 1984
3.937 mln
+1.534 mln
63.84%
jan 1, 1985
3.958 mln
+21.0K
0.53%
jan 1, 1986
4.752 mln
+794.0K
20.06%
jan 1, 1987
10.353 mln
+5.601 mln
117.87%
jan 1, 1988
25.472 mln
+15.119 mln
146.03%
jan 1, 1989
41.324 mln
+15.852 mln
62.23%
jan 1, 1990
59.0 mln
+17.676 mln
42.77%
jan 1, 1991
132.0 mln
+73.0 mln
123.73%
jan 1, 1992
238.0 mln
+106.0 mln
80.3%
jan 1, 1993
540.0 mln
+302.0 mln
126.89%
jan 1, 1994
1.04 bln
+500.0 mln
92.59%
jan 1, 1995
1.79 bln
+750.0 mln
72.12%
jan 1, 1996
2.541 bln
+751.0 mln
41.96%
jan 1, 1997
3.014 bln
+473.0 mln
18.61%
jan 1, 1998
4.428 bln
+1.414 bln
46.91%
jan 1, 1999
5.03 bln
+602.0 mln
13.6%
jan 1, 2000
6.571 bln
+1.541 bln
30.64%
jan 1, 2001
7.853 bln
+1.282 bln
19.51%
jan 1, 2002
8.721 bln
+868.107 mln
11.05%
jan 1, 2003
9.863 bln
+1.142 bln
13.1%
jan 1, 2004
9.686 bln
-177.399 mln
-1.8%
jan 1, 2005
11.634 bln
+1.948 bln
20.11%
jan 1, 2006
12.957 bln
+1.323 bln
11.37%
jan 1, 2007
12.929 bln
-27.822 mln
-0.21%
jan 1, 2008
14.216 bln
+1.287 bln
9.95%
jan 1, 2009
15.498 bln
+1.282 bln
9.02%
jan 1, 2010
13.092 bln
-2.406 bln
-15.53%
jan 1, 2011
17.309 bln
+4.218 bln
32.22%
jan 1, 2012
16.707 bln
-602.336 mln
-3.48%
jan 1, 2013
15.327 bln
-1.38 bln
-8.26%
jan 1, 2014
23.456 bln
+8.129 bln
53.04%
jan 1, 2015
24.523 bln
+1.067 bln
4.55%
Ranking of countries by current statistics by years


Comments: