29
/
en
AIzaSyAYiBZKx7MnpbEhh9jyipgxe19OcubqV5w
April 1, 2024
199223
Mongolia
MNG
true
2
1
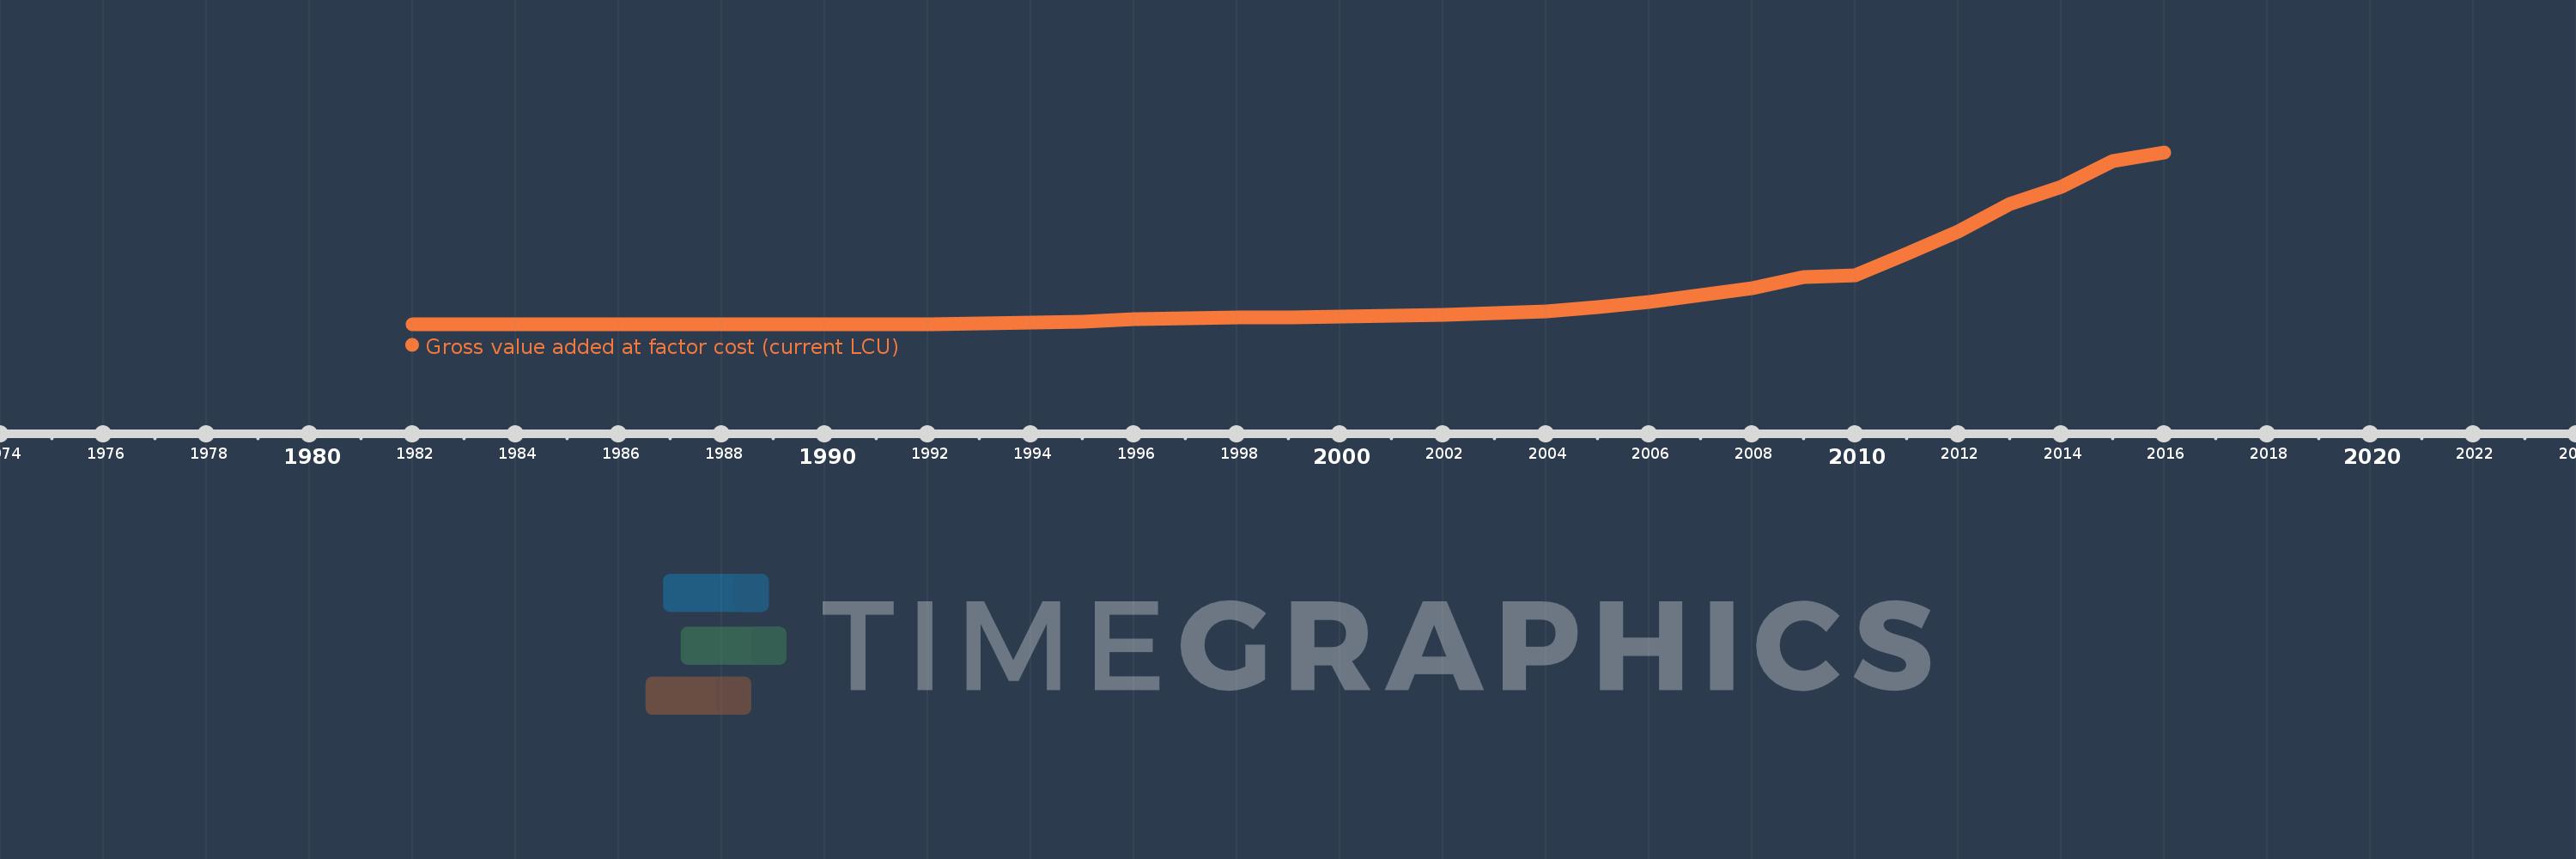
Gross value added at factor cost (current LCU)
2016,2015,2014,2013,2012,2011,2010,2009,2008,2007,2006,2005,2004,2003,2002,2001,2000,1999,1998,1997,1996,1995,1994,1993,1992,1991,1990,1989,1988,1987,1986,1985,1984,1983,1982
This statistics in other country:
AfghanistanAlbaniaAlgeriaAndorraAntigua and BarbudaArgentinaArmeniaArubaAustraliaAustriaAzerbaijanBahamas, TheBahrainBangladeshBarbadosBelarusBelgiumBelizeBeninBermudaBhutanBoliviaBosnia and HerzegovinaBotswanaBrazilBulgariaBurkina FasoBurundiCabo VerdeCambodiaCameroonCanadaCayman IslandsCentral African RepublicChadChileColombiaCongo, Dem. Rep.Costa RicaCroatiaCubaCyprusCzech RepublicDenmarkDjiboutiDominicaDominican RepublicEcuadorEgypt, Arab Rep.El SalvadorEquatorial GuineaEritreaEstoniaEthiopiaFaroe IslandsFijiFinlandFranceGabonGambia, TheGeorgiaGermanyGhanaGreeceGrenadaGuatemalaGuineaGuinea-BissauGuyanaHondurasHong Kong SAR, ChinaHungaryIcelandIndiaIndonesiaIran, Islamic Rep.IrelandItalyJamaicaJapanJordanKazakhstanKenyaKiribatiKorea, Rep.KosovoKuwaitKyrgyz RepublicLao PDRLatviaLebanonLesothoLiberiaLibyaLiechtensteinLithuaniaLuxembourgMacao SAR, ChinaMacedonia, FYRMadagascarMalawiMalaysiaMaldivesMaliMaltaMarshall IslandsMauritaniaMauritiusMexicoMicronesia, Fed. Sts.MoldovaMongoliaMontenegroMoroccoMozambiqueNamibiaNepalNetherlandsNew ZealandNicaraguaNigeriaNorwayOmanPakistanPalauPanamaPapua New GuineaParaguayPeruPolandPortugalRomaniaRussian FederationRwandaSao Tome and PrincipeSenegalSerbiaSeychellesSierra LeoneSingaporeSlovak RepublicSloveniaSolomon IslandsSomaliaSouth AfricaSpainSri LankaSt. Kitts and NevisSt. LuciaSt. Vincent and the GrenadinesSudanSurinameSwazilandSwedenSwitzerlandSyrian Arab RepublicTajikistanTanzaniaThailandTimor-LesteTongaTrinidad and TobagoTunisiaTurkeyTurkmenistanTuvaluUgandaUkraineUnited KingdomUnited StatesUruguayUzbekistanVanuatuVenezuela, RBVietnamWest Bank and GazaYemen, Rep.ZambiaZimbabwe Timeline:
This timeline shows a graph from 1982 to 2016 of Mongolia. No data until 1981. Number of actual observations by date: 35.
Source name:
World Development Indicators
Source organization:
World Bank national accounts data, and OECD National Accounts data files.
Categories, topics:
Economy & Growth
Last updated:
apr 23, 2017
Indicators value changes by year
Minimum:
6.93 bln
jan 1, 1982
Maximum:
21.248 trl
jan 1, 2016
At the date of observation
Value
Absolute change
Change from previous value
jan 1, 1982
6.93 bln
+6.93 bln
0.0%
jan 1, 1983
7.657 bln
+726.909 mln
10.49%
jan 1, 1984
8.177 bln
+520.004 mln
6.79%
jan 1, 1985
8.395 bln
+217.728 mln
2.66%
jan 1, 1986
8.746 bln
+351.084 mln
4.18%
jan 1, 1987
8.689 bln
-57.485 mln
-0.66%
jan 1, 1988
9.062 bln
+373.298 mln
4.3%
jan 1, 1989
9.613 bln
+551.55 mln
6.09%
jan 1, 1990
10.731 bln
+1.118 bln
11.62%
jan 1, 1991
12.422 bln
+1.692 bln
15.76%
jan 1, 1992
20.371 bln
+7.949 bln
63.99%
jan 1, 1993
52.755 bln
+32.383 bln
158.97%
jan 1, 1994
210.164 bln
+157.409 bln
298.38%
jan 1, 1995
358.578 bln
+148.414 bln
70.62%
jan 1, 1996
616.934 bln
+258.356 bln
72.05%
jan 1, 1997
692.869 bln
+75.935 bln
12.31%
jan 1, 1998
866.038 bln
+173.169 bln
24.99%
jan 1, 1999
873.762 bln
+7.725 bln
0.89%
jan 1, 2000
985.202 bln
+111.439 bln
12.75%
jan 1, 2001
1.087 trl
+101.968 bln
10.35%
jan 1, 2002
1.213 trl
+126.086 bln
11.6%
jan 1, 2003
1.365 trl
+151.251 bln
12.47%
jan 1, 2004
1.624 trl
+259.962 bln
19.05%
jan 1, 2005
2.092 trl
+467.471 bln
28.78%
jan 1, 2006
2.73 trl
+637.729 bln
30.49%
jan 1, 2007
3.622 trl
+892.637 bln
32.7%
jan 1, 2008
4.465 trl
+842.476 bln
23.26%
jan 1, 2009
5.883 trl
+1.418 trl
31.76%
jan 1, 2010
5.999 trl
+116.117 bln
1.97%
jan 1, 2011
8.758 trl
+2.759 trl
46.0%
jan 1, 2012
11.517 trl
+2.759 trl
31.5%
jan 1, 2013
14.834 trl
+3.317 trl
28.8%
jan 1, 2014
16.996 trl
+2.162 trl
14.57%
jan 1, 2015
20.152 trl
+3.156 trl
18.57%
jan 1, 2016
21.248 trl
+1.097 trl
5.44%
Ranking of countries by current statistics by years


Comments: