29
/
en
AIzaSyAYiBZKx7MnpbEhh9jyipgxe19OcubqV5w
April 1, 2024
180611
Liechtenstein
LIE
true
2
1
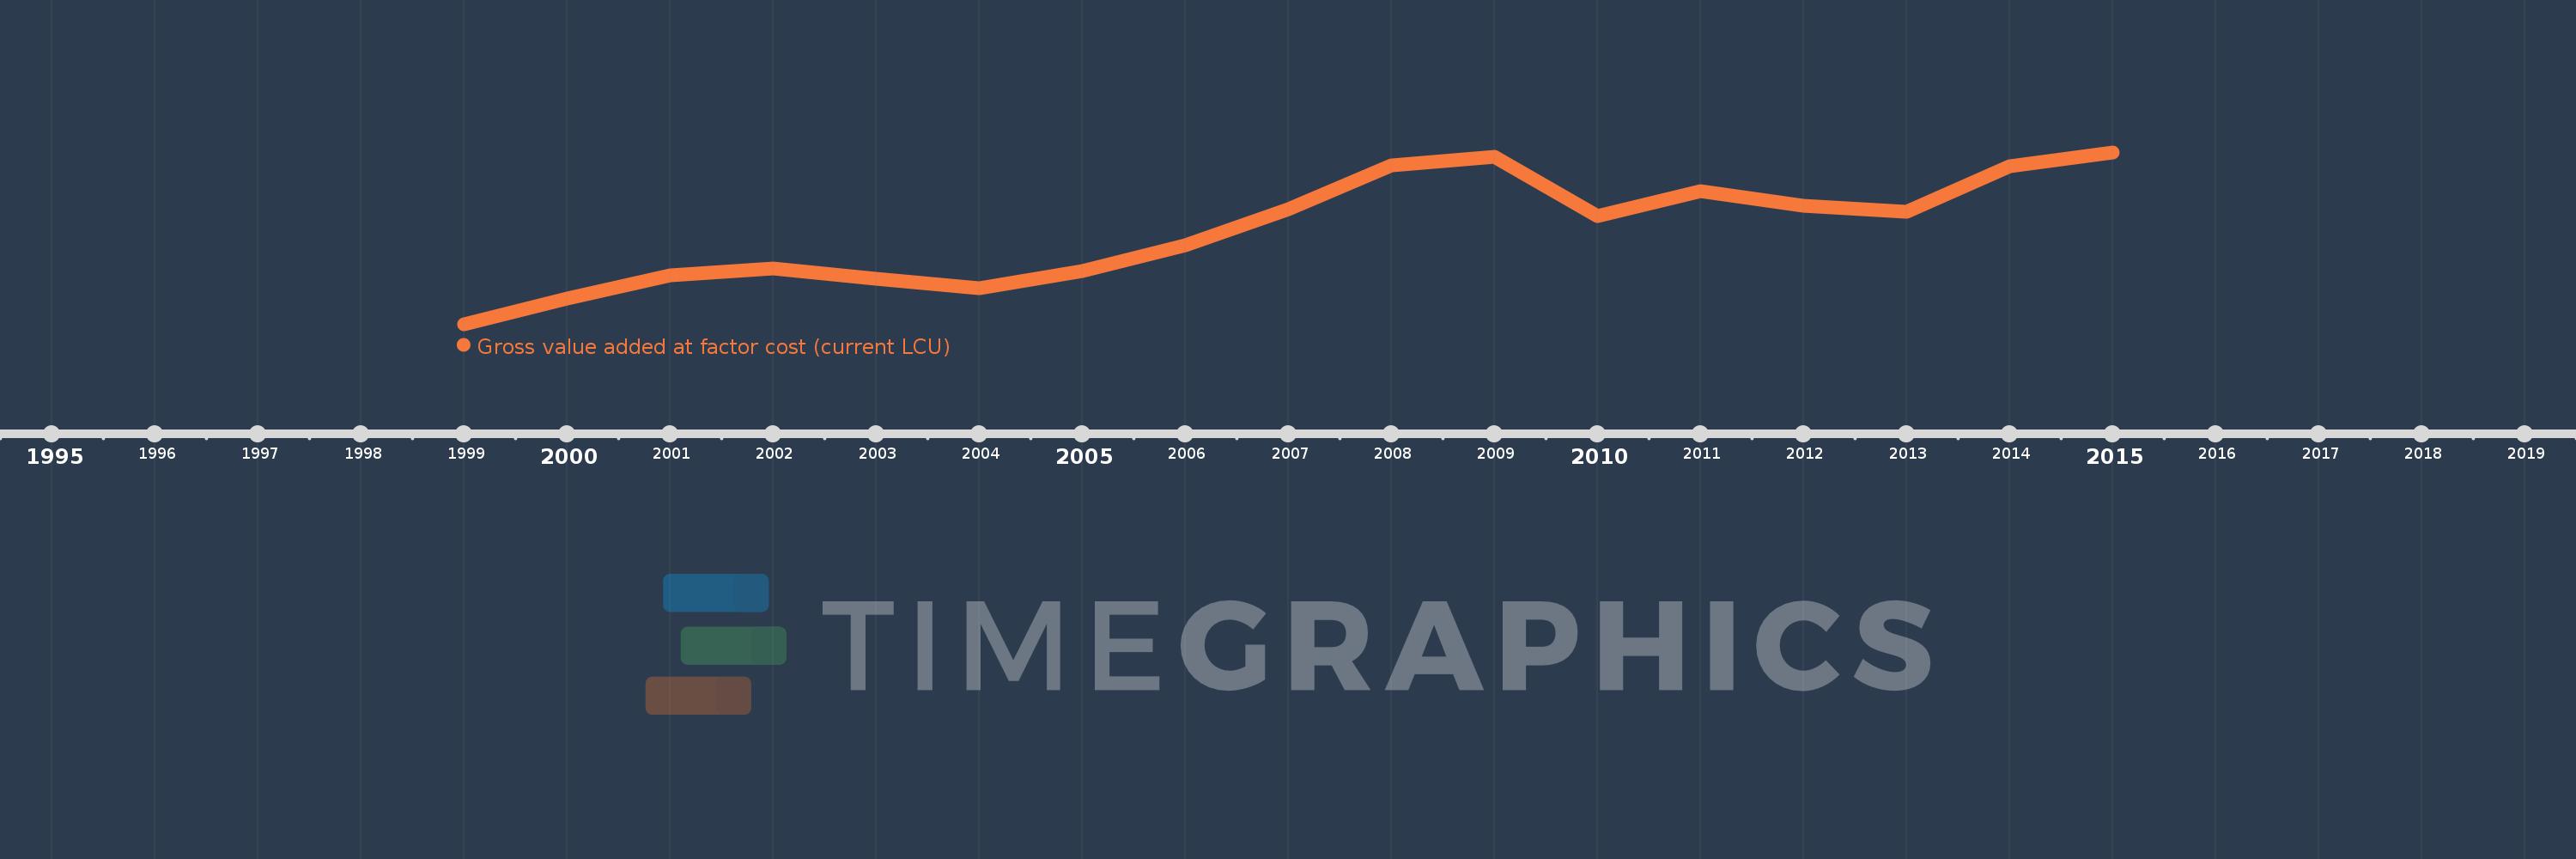
Gross value added at factor cost (current LCU)
2015,2014,2013,2012,2011,2010,2009,2008,2007,2006,2005,2004,2003,2002,2001,2000,1999
This statistics in other country:
AfghanistanAlbaniaAlgeriaAndorraAntigua and BarbudaArgentinaArmeniaArubaAustraliaAustriaAzerbaijanBahamas, TheBahrainBangladeshBarbadosBelarusBelgiumBelizeBeninBermudaBhutanBoliviaBosnia and HerzegovinaBotswanaBrazilBulgariaBurkina FasoBurundiCabo VerdeCambodiaCameroonCanadaCayman IslandsCentral African RepublicChadChileColombiaCongo, Dem. Rep.Costa RicaCroatiaCubaCyprusCzech RepublicDenmarkDjiboutiDominicaDominican RepublicEcuadorEgypt, Arab Rep.El SalvadorEquatorial GuineaEritreaEstoniaEthiopiaFaroe IslandsFijiFinlandFranceGabonGambia, TheGeorgiaGermanyGhanaGreeceGrenadaGuatemalaGuineaGuinea-BissauGuyanaHondurasHong Kong SAR, ChinaHungaryIcelandIndiaIndonesiaIran, Islamic Rep.IrelandItalyJamaicaJapanJordanKazakhstanKenyaKiribatiKorea, Rep.KosovoKuwaitKyrgyz RepublicLao PDRLatviaLebanonLesothoLiberiaLibyaLiechtensteinLithuaniaLuxembourgMacao SAR, ChinaMacedonia, FYRMadagascarMalawiMalaysiaMaldivesMaliMaltaMarshall IslandsMauritaniaMauritiusMexicoMicronesia, Fed. Sts.MoldovaMongoliaMontenegroMoroccoMozambiqueNamibiaNepalNetherlandsNew ZealandNicaraguaNigeriaNorwayOmanPakistanPalauPanamaPapua New GuineaParaguayPeruPolandPortugalRomaniaRussian FederationRwandaSao Tome and PrincipeSenegalSerbiaSeychellesSierra LeoneSingaporeSlovak RepublicSloveniaSolomon IslandsSomaliaSouth AfricaSpainSri LankaSt. Kitts and NevisSt. LuciaSt. Vincent and the GrenadinesSudanSurinameSwazilandSwedenSwitzerlandSyrian Arab RepublicTajikistanTanzaniaThailandTimor-LesteTongaTrinidad and TobagoTunisiaTurkeyTurkmenistanTuvaluUgandaUkraineUnited KingdomUnited StatesUruguayUzbekistanVanuatuVenezuela, RBVietnamWest Bank and GazaYemen, Rep.ZambiaZimbabwe Timeline:
This timeline shows a graph from 1999 to 2015 of Liechtenstein. No data until 1998. Number of actual observations by date: 17.
Source name:
World Development Indicators
Source organization:
World Bank national accounts data, and OECD National Accounts data files.
Categories, topics:
Economy & Growth
Last updated:
apr 23, 2017
Indicators value changes by year
Minimum:
3.703 bln
jan 1, 1999
Maximum:
5.902 bln
jan 1, 2015
At the date of observation
Value
Absolute change
Change from previous value
jan 1, 1999
3.703 bln
+3.703 bln
0.0%
jan 1, 2000
4.033 bln
+330.1 mln
8.91%
jan 1, 2001
4.328 bln
+294.2 mln
7.29%
jan 1, 2002
4.416 bln
+88.2 mln
2.04%
jan 1, 2003
4.289 bln
-126.5 mln
-2.86%
jan 1, 2004
4.161 bln
-128.4 mln
-2.99%
jan 1, 2005
4.388 bln
+226.8 mln
5.45%
jan 1, 2006
4.71 bln
+321.8 mln
7.33%
jan 1, 2007
5.179 bln
+469.9 mln
9.98%
jan 1, 2008
5.737 bln
+558.0 mln
10.77%
jan 1, 2009
5.847 bln
+109.4 mln
1.91%
jan 1, 2010
5.085 bln
-761.5 mln
-13.02%
jan 1, 2011
5.411 bln
+325.9 mln
6.41%
jan 1, 2012
5.215 bln
-195.7 mln
-3.62%
jan 1, 2013
5.141 bln
-74.6 mln
-1.43%
jan 1, 2014
5.728 bln
+587.1 mln
11.42%
jan 1, 2015
5.902 bln
+173.9 mln
3.04%
Ranking of countries by current statistics by years


Comments: