29
/
en
AIzaSyAYiBZKx7MnpbEhh9jyipgxe19OcubqV5w
April 1, 2024
131487
Faroe Islands
FRO
true
2
1
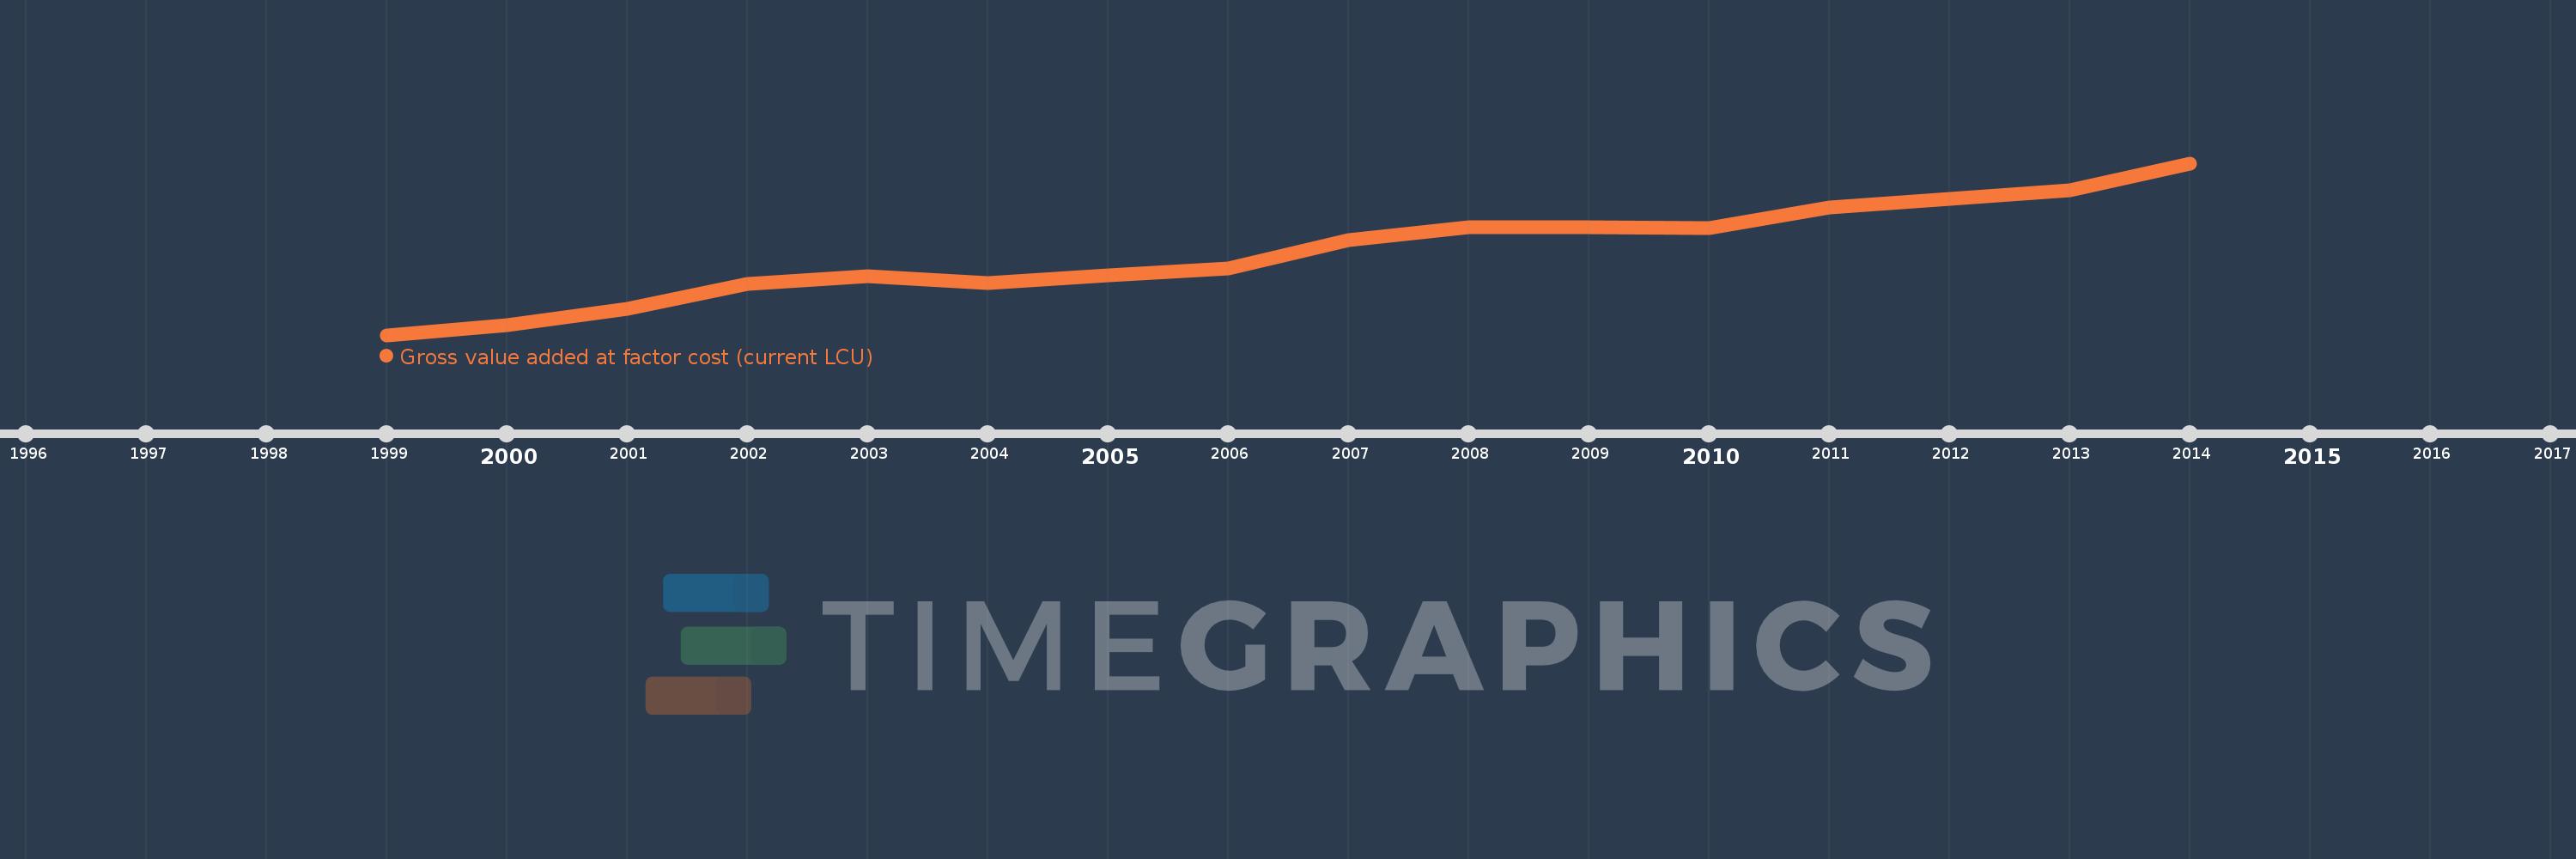
Gross value added at factor cost (current LCU)
2014,2013,2012,2011,2010,2009,2008,2007,2006,2005,2004,2003,2002,2001,2000,1999
This statistics in other country:
AfghanistanAlbaniaAlgeriaAndorraAntigua and BarbudaArgentinaArmeniaArubaAustraliaAustriaAzerbaijanBahamas, TheBahrainBangladeshBarbadosBelarusBelgiumBelizeBeninBermudaBhutanBoliviaBosnia and HerzegovinaBotswanaBrazilBulgariaBurkina FasoBurundiCabo VerdeCambodiaCameroonCanadaCayman IslandsCentral African RepublicChadChileColombiaCongo, Dem. Rep.Costa RicaCroatiaCubaCyprusCzech RepublicDenmarkDjiboutiDominicaDominican RepublicEcuadorEgypt, Arab Rep.El SalvadorEquatorial GuineaEritreaEstoniaEthiopiaFaroe IslandsFijiFinlandFranceGabonGambia, TheGeorgiaGermanyGhanaGreeceGrenadaGuatemalaGuineaGuinea-BissauGuyanaHondurasHong Kong SAR, ChinaHungaryIcelandIndiaIndonesiaIran, Islamic Rep.IrelandItalyJamaicaJapanJordanKazakhstanKenyaKiribatiKorea, Rep.KosovoKuwaitKyrgyz RepublicLao PDRLatviaLebanonLesothoLiberiaLibyaLiechtensteinLithuaniaLuxembourgMacao SAR, ChinaMacedonia, FYRMadagascarMalawiMalaysiaMaldivesMaliMaltaMarshall IslandsMauritaniaMauritiusMexicoMicronesia, Fed. Sts.MoldovaMongoliaMontenegroMoroccoMozambiqueNamibiaNepalNetherlandsNew ZealandNicaraguaNigeriaNorwayOmanPakistanPalauPanamaPapua New GuineaParaguayPeruPolandPortugalRomaniaRussian FederationRwandaSao Tome and PrincipeSenegalSerbiaSeychellesSierra LeoneSingaporeSlovak RepublicSloveniaSolomon IslandsSomaliaSouth AfricaSpainSri LankaSt. Kitts and NevisSt. LuciaSt. Vincent and the GrenadinesSudanSurinameSwazilandSwedenSwitzerlandSyrian Arab RepublicTajikistanTanzaniaThailandTimor-LesteTongaTrinidad and TobagoTunisiaTurkeyTurkmenistanTuvaluUgandaUkraineUnited KingdomUnited StatesUruguayUzbekistanVanuatuVenezuela, RBVietnamWest Bank and GazaYemen, Rep.ZambiaZimbabwe Timeline:
This timeline shows a graph from 1999 to 2014 of Faroe Islands. No data until 1998. Number of actual observations by date: 16.
Source name:
World Development Indicators
Source organization:
World Bank national accounts data, and OECD National Accounts data files.
Categories, topics:
Economy & Growth
Last updated:
apr 23, 2017
Indicators value changes by year
Minimum:
6.41 bln
jan 1, 1999
Maximum:
12.985 bln
jan 1, 2014
At the date of observation
Value
Absolute change
Change from previous value
jan 1, 1999
6.41 bln
+6.41 bln
0.0%
jan 1, 2000
6.785 bln
+375.0 mln
5.85%
jan 1, 2001
7.429 bln
+644.0 mln
9.49%
jan 1, 2002
8.382 bln
+953.0 mln
12.83%
jan 1, 2003
8.671 bln
+289.0 mln
3.45%
jan 1, 2004
8.407 bln
-264.0 mln
-3.04%
jan 1, 2005
8.687 bln
+280.0 mln
3.33%
jan 1, 2006
8.944 bln
+257.0 mln
2.96%
jan 1, 2007
10.033 bln
+1.089 bln
12.18%
jan 1, 2008
10.52 bln
+487.0 mln
4.85%
jan 1, 2009
10.52 bln
0.0
0.0%
jan 1, 2010
10.515 bln
-5.0 mln
-0.05%
jan 1, 2011
11.276 bln
+761.0 mln
7.24%
jan 1, 2012
11.606 bln
+330.0 mln
2.93%
jan 1, 2013
11.943 bln
+337.0 mln
2.9%
jan 1, 2014
12.985 bln
+1.042 bln
8.72%
Ranking of countries by current statistics by years


Comments: