29
/
en
AIzaSyAYiBZKx7MnpbEhh9jyipgxe19OcubqV5w
April 1, 2024
258398
Syrian Arab Republic
SYR
true
2
1
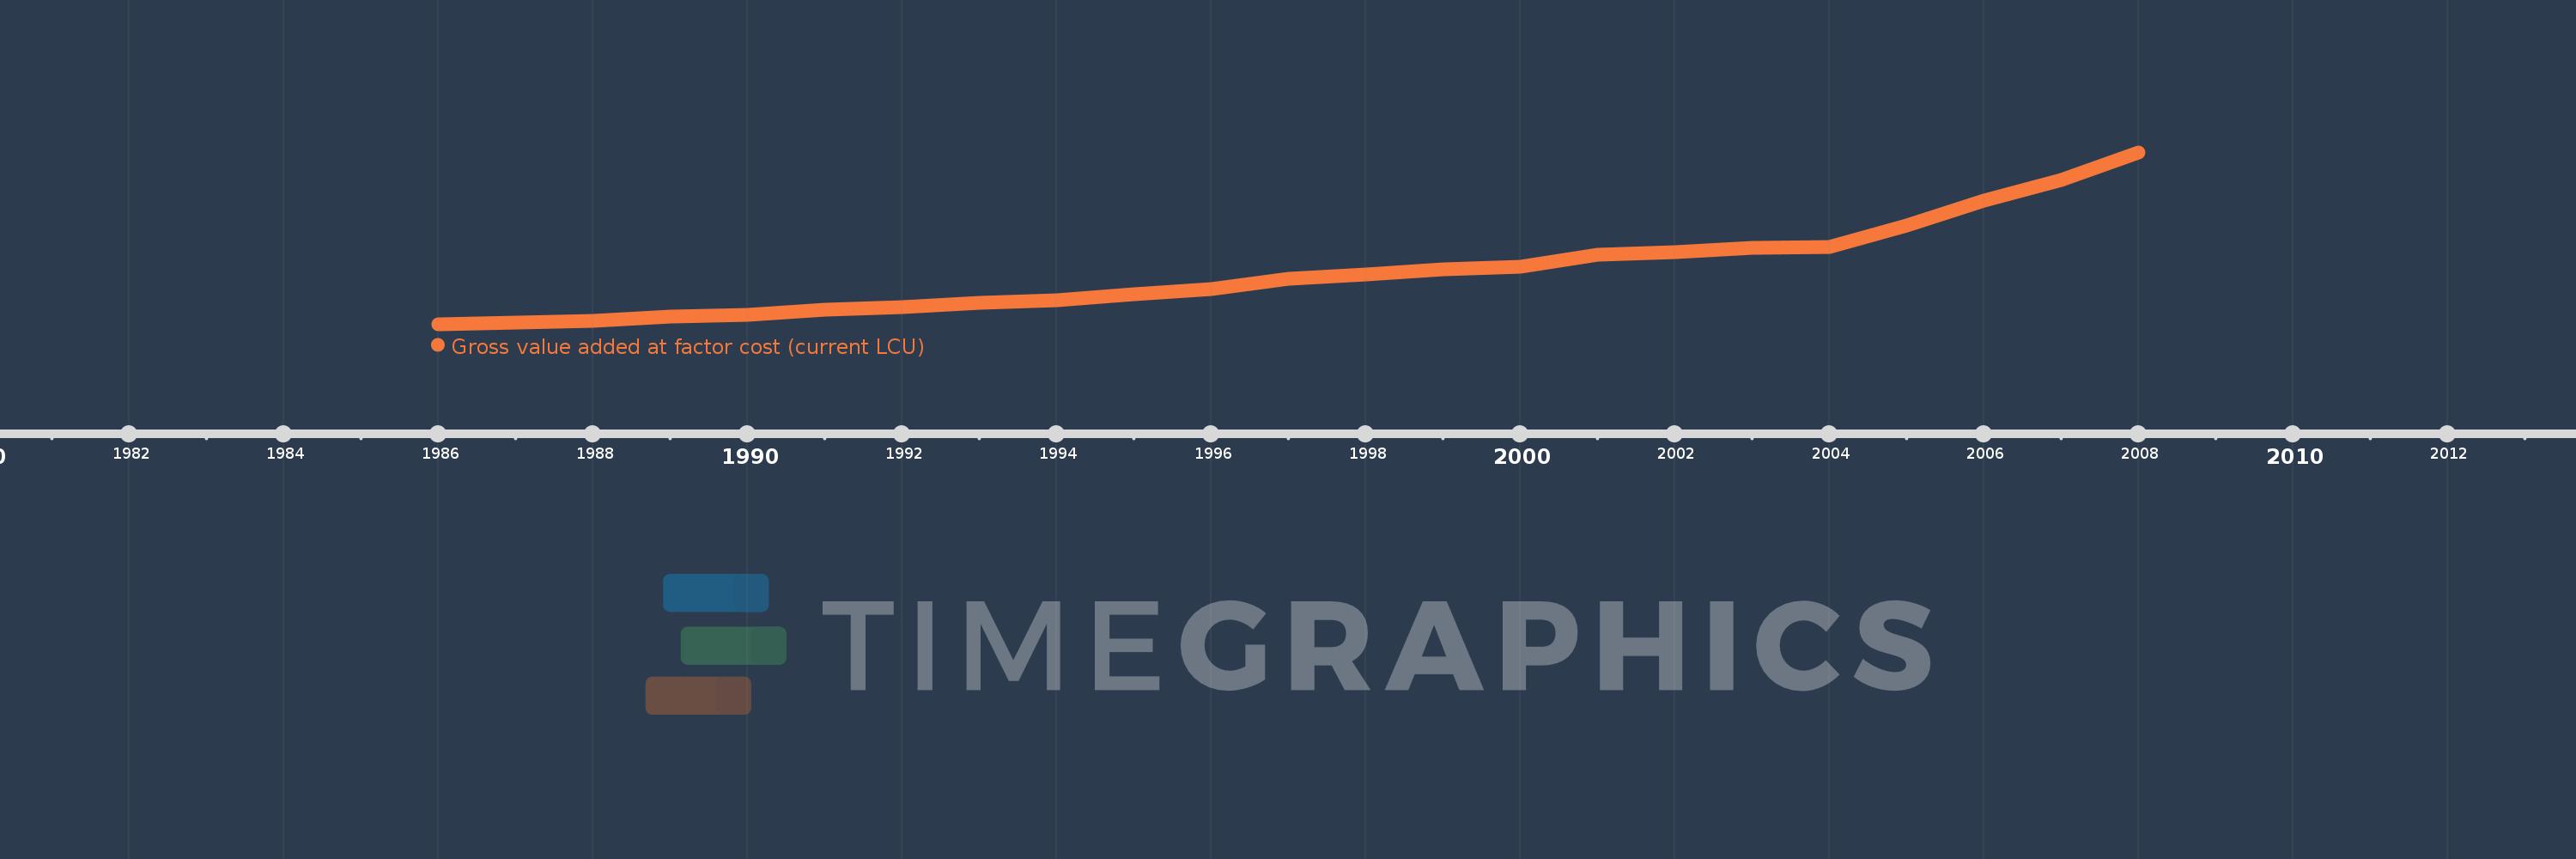
Gross value added at factor cost (current LCU)
2008,2007,2006,2005,2004,2003,2002,2001,2000,1999,1998,1997,1996,1995,1994,1993,1992,1991,1990,1989,1988,1987,1986
This statistics in other country:
AfghanistanAlbaniaAlgeriaAndorraAntigua and BarbudaArgentinaArmeniaArubaAustraliaAustriaAzerbaijanBahamas, TheBahrainBangladeshBarbadosBelarusBelgiumBelizeBeninBermudaBhutanBoliviaBosnia and HerzegovinaBotswanaBrazilBulgariaBurkina FasoBurundiCabo VerdeCambodiaCameroonCanadaCayman IslandsCentral African RepublicChadChileColombiaCongo, Dem. Rep.Costa RicaCroatiaCubaCyprusCzech RepublicDenmarkDjiboutiDominicaDominican RepublicEcuadorEgypt, Arab Rep.El SalvadorEquatorial GuineaEritreaEstoniaEthiopiaFaroe IslandsFijiFinlandFranceGabonGambia, TheGeorgiaGermanyGhanaGreeceGrenadaGuatemalaGuineaGuinea-BissauGuyanaHondurasHong Kong SAR, ChinaHungaryIcelandIndiaIndonesiaIran, Islamic Rep.IrelandItalyJamaicaJapanJordanKazakhstanKenyaKiribatiKorea, Rep.KosovoKuwaitKyrgyz RepublicLao PDRLatviaLebanonLesothoLiberiaLibyaLiechtensteinLithuaniaLuxembourgMacao SAR, ChinaMacedonia, FYRMadagascarMalawiMalaysiaMaldivesMaliMaltaMarshall IslandsMauritaniaMauritiusMexicoMicronesia, Fed. Sts.MoldovaMongoliaMontenegroMoroccoMozambiqueNamibiaNepalNetherlandsNew ZealandNicaraguaNigeriaNorwayOmanPakistanPalauPanamaPapua New GuineaParaguayPeruPolandPortugalRomaniaRussian FederationRwandaSao Tome and PrincipeSenegalSerbiaSeychellesSierra LeoneSingaporeSlovak RepublicSloveniaSolomon IslandsSomaliaSouth AfricaSpainSri LankaSt. Kitts and NevisSt. LuciaSt. Vincent and the GrenadinesSudanSurinameSwazilandSwedenSwitzerlandSyrian Arab RepublicTajikistanTanzaniaThailandTimor-LesteTongaTrinidad and TobagoTunisiaTurkeyTurkmenistanTuvaluUgandaUkraineUnited KingdomUnited StatesUruguayUzbekistanVanuatuVenezuela, RBVietnamWest Bank and GazaYemen, Rep.ZambiaZimbabwe Timeline:
This timeline shows a graph from 1986 to 2008 of Syrian Arab Republic. No data until 1985. Number of actual observations by date: 23.
Source name:
World Development Indicators
Source organization:
World Bank national accounts data, and OECD National Accounts data files.
Categories, topics:
Economy & Growth
Last updated:
apr 23, 2017
Indicators value changes by year
Minimum:
78.961 bln
jan 1, 1986
Maximum:
2.198 trl
jan 1, 2008
At the date of observation
Value
Absolute change
Change from previous value
jan 1, 1986
78.961 bln
+78.961 bln
0.0%
jan 1, 1987
94.813 bln
+15.852 bln
20.08%
jan 1, 1988
121.168 bln
+26.356 bln
27.8%
jan 1, 1989
176.514 bln
+55.346 bln
45.68%
jan 1, 1990
198.188 bln
+21.674 bln
12.28%
jan 1, 1991
254.579 bln
+56.391 bln
28.45%
jan 1, 1992
291.032 bln
+36.453 bln
14.32%
jan 1, 1993
342.225 bln
+51.193 bln
17.59%
jan 1, 1994
372.944 bln
+30.719 bln
8.98%
jan 1, 1995
453.055 bln
+80.111 bln
21.48%
jan 1, 1996
509.971 bln
+56.916 bln
12.56%
jan 1, 1997
639.444 bln
+129.473 bln
25.39%
jan 1, 1998
689.242 bln
+49.798 bln
7.79%
jan 1, 1999
758.97 bln
+69.728 bln
10.12%
jan 1, 2000
785.058 bln
+26.088 bln
3.44%
jan 1, 2001
938.458 bln
+153.4 bln
19.54%
jan 1, 2002
971.812 bln
+33.354 bln
3.55%
jan 1, 2003
1.017 trl
+45.164 bln
4.65%
jan 1, 2004
1.032 trl
+15.026 bln
1.48%
jan 1, 2005
1.294 trl
+262.046 bln
25.39%
jan 1, 2006
1.602 trl
+307.99 bln
23.8%
jan 1, 2007
1.862 trl
+260.233 bln
16.24%
jan 1, 2008
2.198 trl
+335.268 bln
18.0%
Ranking of countries by current statistics by years


Comments: