29
/
en
AIzaSyAYiBZKx7MnpbEhh9jyipgxe19OcubqV5w
April 1, 2024
183945
Macedonia, FYR
MKD
true
2
1
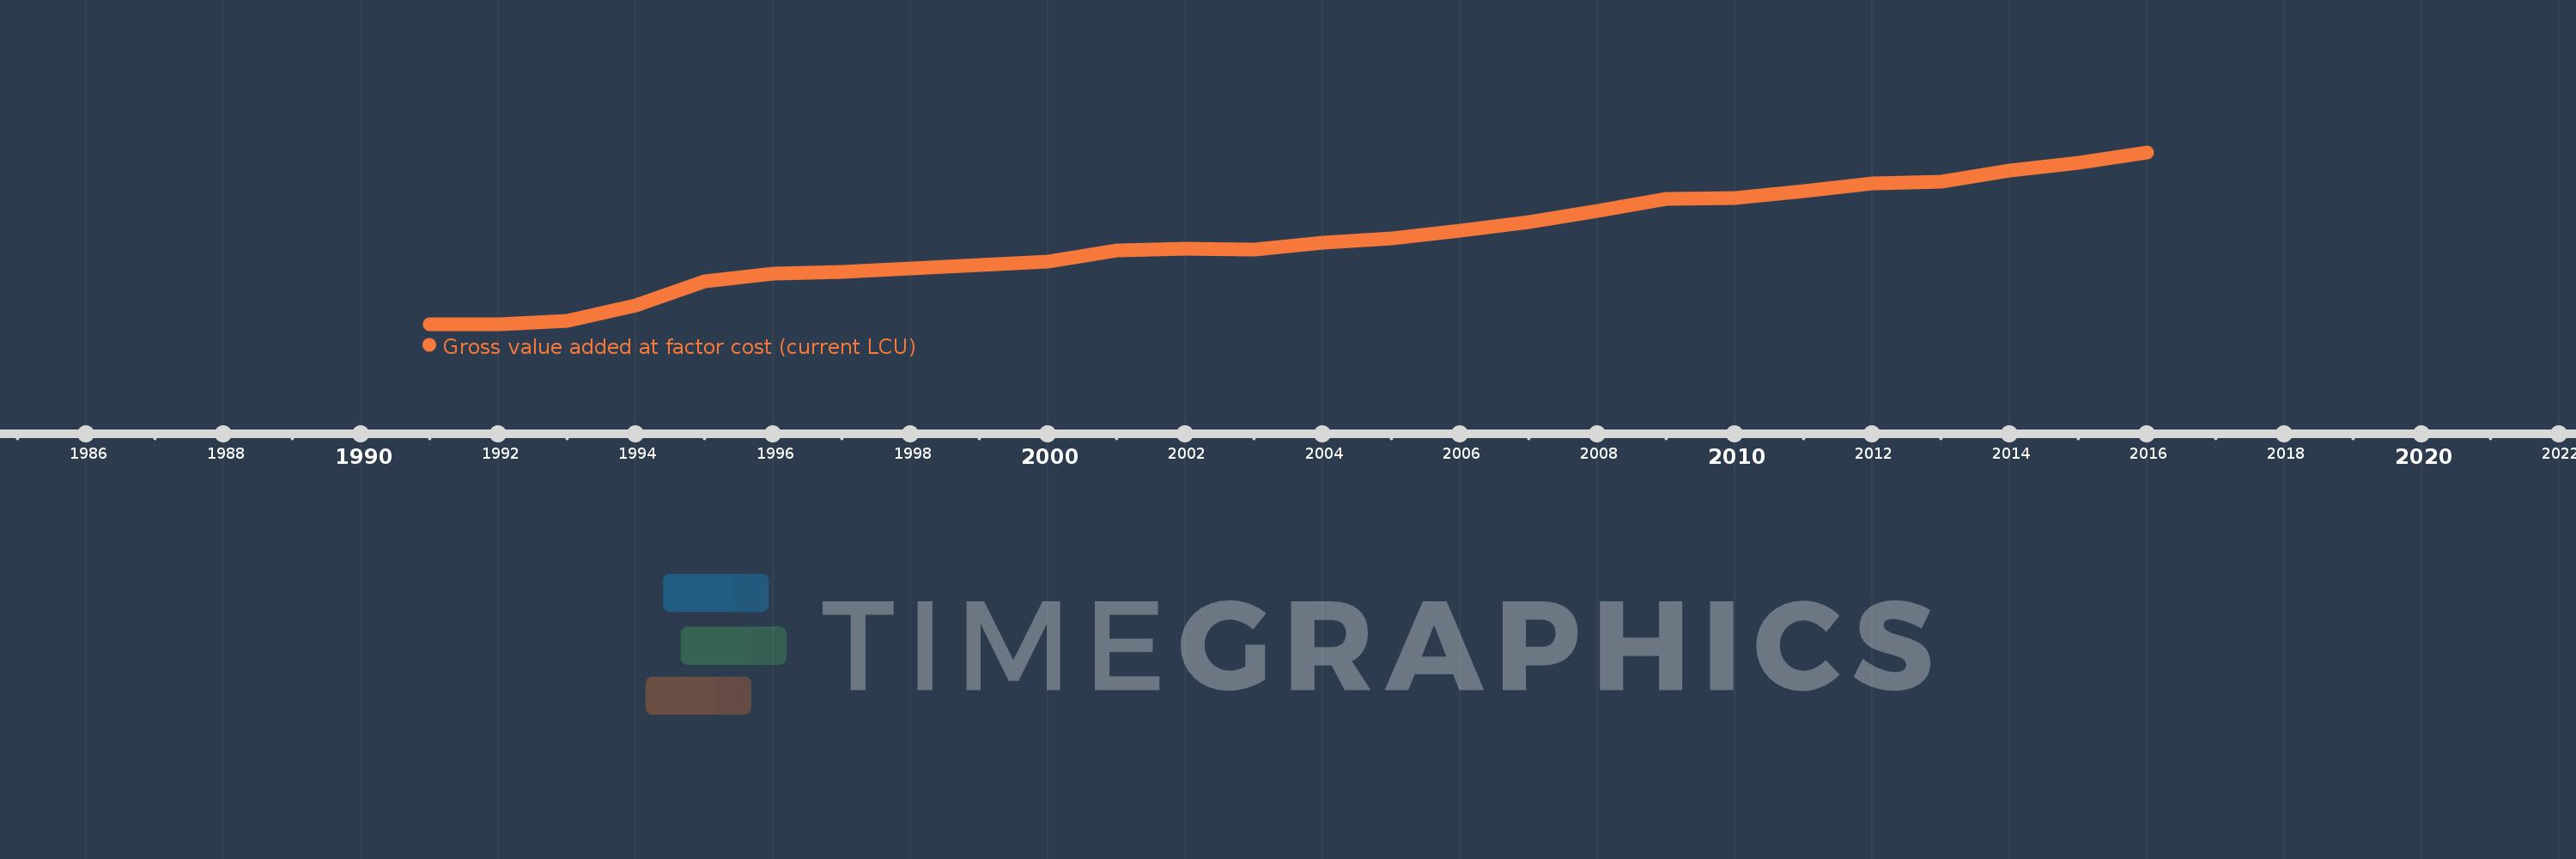
Gross value added at factor cost (current LCU)
2016,2015,2014,2013,2012,2011,2010,2009,2008,2007,2006,2005,2004,2003,2002,2001,2000,1999,1998,1997,1996,1995,1994,1993,1992,1991
This statistics in other country:
AfghanistanAlbaniaAlgeriaAndorraAntigua and BarbudaArgentinaArmeniaArubaAustraliaAustriaAzerbaijanBahamas, TheBahrainBangladeshBarbadosBelarusBelgiumBelizeBeninBermudaBhutanBoliviaBosnia and HerzegovinaBotswanaBrazilBulgariaBurkina FasoBurundiCabo VerdeCambodiaCameroonCanadaCayman IslandsCentral African RepublicChadChileColombiaCongo, Dem. Rep.Costa RicaCroatiaCubaCyprusCzech RepublicDenmarkDjiboutiDominicaDominican RepublicEcuadorEgypt, Arab Rep.El SalvadorEquatorial GuineaEritreaEstoniaEthiopiaFaroe IslandsFijiFinlandFranceGabonGambia, TheGeorgiaGermanyGhanaGreeceGrenadaGuatemalaGuineaGuinea-BissauGuyanaHondurasHong Kong SAR, ChinaHungaryIcelandIndiaIndonesiaIran, Islamic Rep.IrelandItalyJamaicaJapanJordanKazakhstanKenyaKiribatiKorea, Rep.KosovoKuwaitKyrgyz RepublicLao PDRLatviaLebanonLesothoLiberiaLibyaLiechtensteinLithuaniaLuxembourgMacao SAR, ChinaMacedonia, FYRMadagascarMalawiMalaysiaMaldivesMaliMaltaMarshall IslandsMauritaniaMauritiusMexicoMicronesia, Fed. Sts.MoldovaMongoliaMontenegroMoroccoMozambiqueNamibiaNepalNetherlandsNew ZealandNicaraguaNigeriaNorwayOmanPakistanPalauPanamaPapua New GuineaParaguayPeruPolandPortugalRomaniaRussian FederationRwandaSao Tome and PrincipeSenegalSerbiaSeychellesSierra LeoneSingaporeSlovak RepublicSloveniaSolomon IslandsSomaliaSouth AfricaSpainSri LankaSt. Kitts and NevisSt. LuciaSt. Vincent and the GrenadinesSudanSurinameSwazilandSwedenSwitzerlandSyrian Arab RepublicTajikistanTanzaniaThailandTimor-LesteTongaTrinidad and TobagoTunisiaTurkeyTurkmenistanTuvaluUgandaUkraineUnited KingdomUnited StatesUruguayUzbekistanVanuatuVenezuela, RBVietnamWest Bank and GazaYemen, Rep.ZambiaZimbabwe Timeline:
This timeline shows a graph from 1991 to 2016 of Macedonia, FYR. No data until 1990. Number of actual observations by date: 26.
Source name:
World Development Indicators
Source organization:
World Bank national accounts data, and OECD National Accounts data files.
Categories, topics:
Economy & Growth
Last updated:
apr 23, 2017
Indicators value changes by year
Minimum:
447.62 mln
jan 1, 1991
Maximum:
487.842 bln
jan 1, 2016
At the date of observation
Value
Absolute change
Change from previous value
jan 1, 1991
447.62 mln
+447.62 mln
0.0%
jan 1, 1992
769.573 mln
+321.953 mln
71.93%
jan 1, 1993
10.533 bln
+9.763 bln
1.27K%
jan 1, 1994
52.77 bln
+42.237 bln
401.0%
jan 1, 1995
122.803 bln
+70.033 bln
132.71%
jan 1, 1996
143.2 bln
+20.397 bln
16.61%
jan 1, 1997
149.477 bln
+6.277 bln
4.38%
jan 1, 1998
159.774 bln
+10.297 bln
6.89%
jan 1, 1999
168.235 bln
+8.461 bln
5.3%
jan 1, 2000
179.316 bln
+11.081 bln
6.59%
jan 1, 2001
209.601 bln
+30.285 bln
16.89%
jan 1, 2002
213.782 bln
+4.181 bln
1.99%
jan 1, 2003
213.203 bln
-579.0 mln
-0.27%
jan 1, 2004
232.178 bln
+18.975 bln
8.9%
jan 1, 2005
243.685 bln
+11.507 bln
4.96%
jan 1, 2006
264.847 bln
+21.162 bln
8.68%
jan 1, 2007
291.105 bln
+26.258 bln
9.91%
jan 1, 2008
321.378 bln
+30.273 bln
10.4%
jan 1, 2009
357.15 bln
+35.772 bln
11.13%
jan 1, 2010
358.369 bln
+1.219 bln
0.34%
jan 1, 2011
377.201 bln
+18.832 bln
5.25%
jan 1, 2012
399.376 bln
+22.175 bln
5.88%
jan 1, 2013
403.684 bln
+4.308 bln
1.08%
jan 1, 2014
436.706 bln
+33.022 bln
8.18%
jan 1, 2015
457.799 bln
+21.093 bln
4.83%
jan 1, 2016
487.842 bln
+30.043 bln
6.56%
Ranking of countries by current statistics by years


Comments: