29
/
en
AIzaSyAYiBZKx7MnpbEhh9jyipgxe19OcubqV5w
April 1, 2024
93647
Bulgaria
BGR
true
2
1
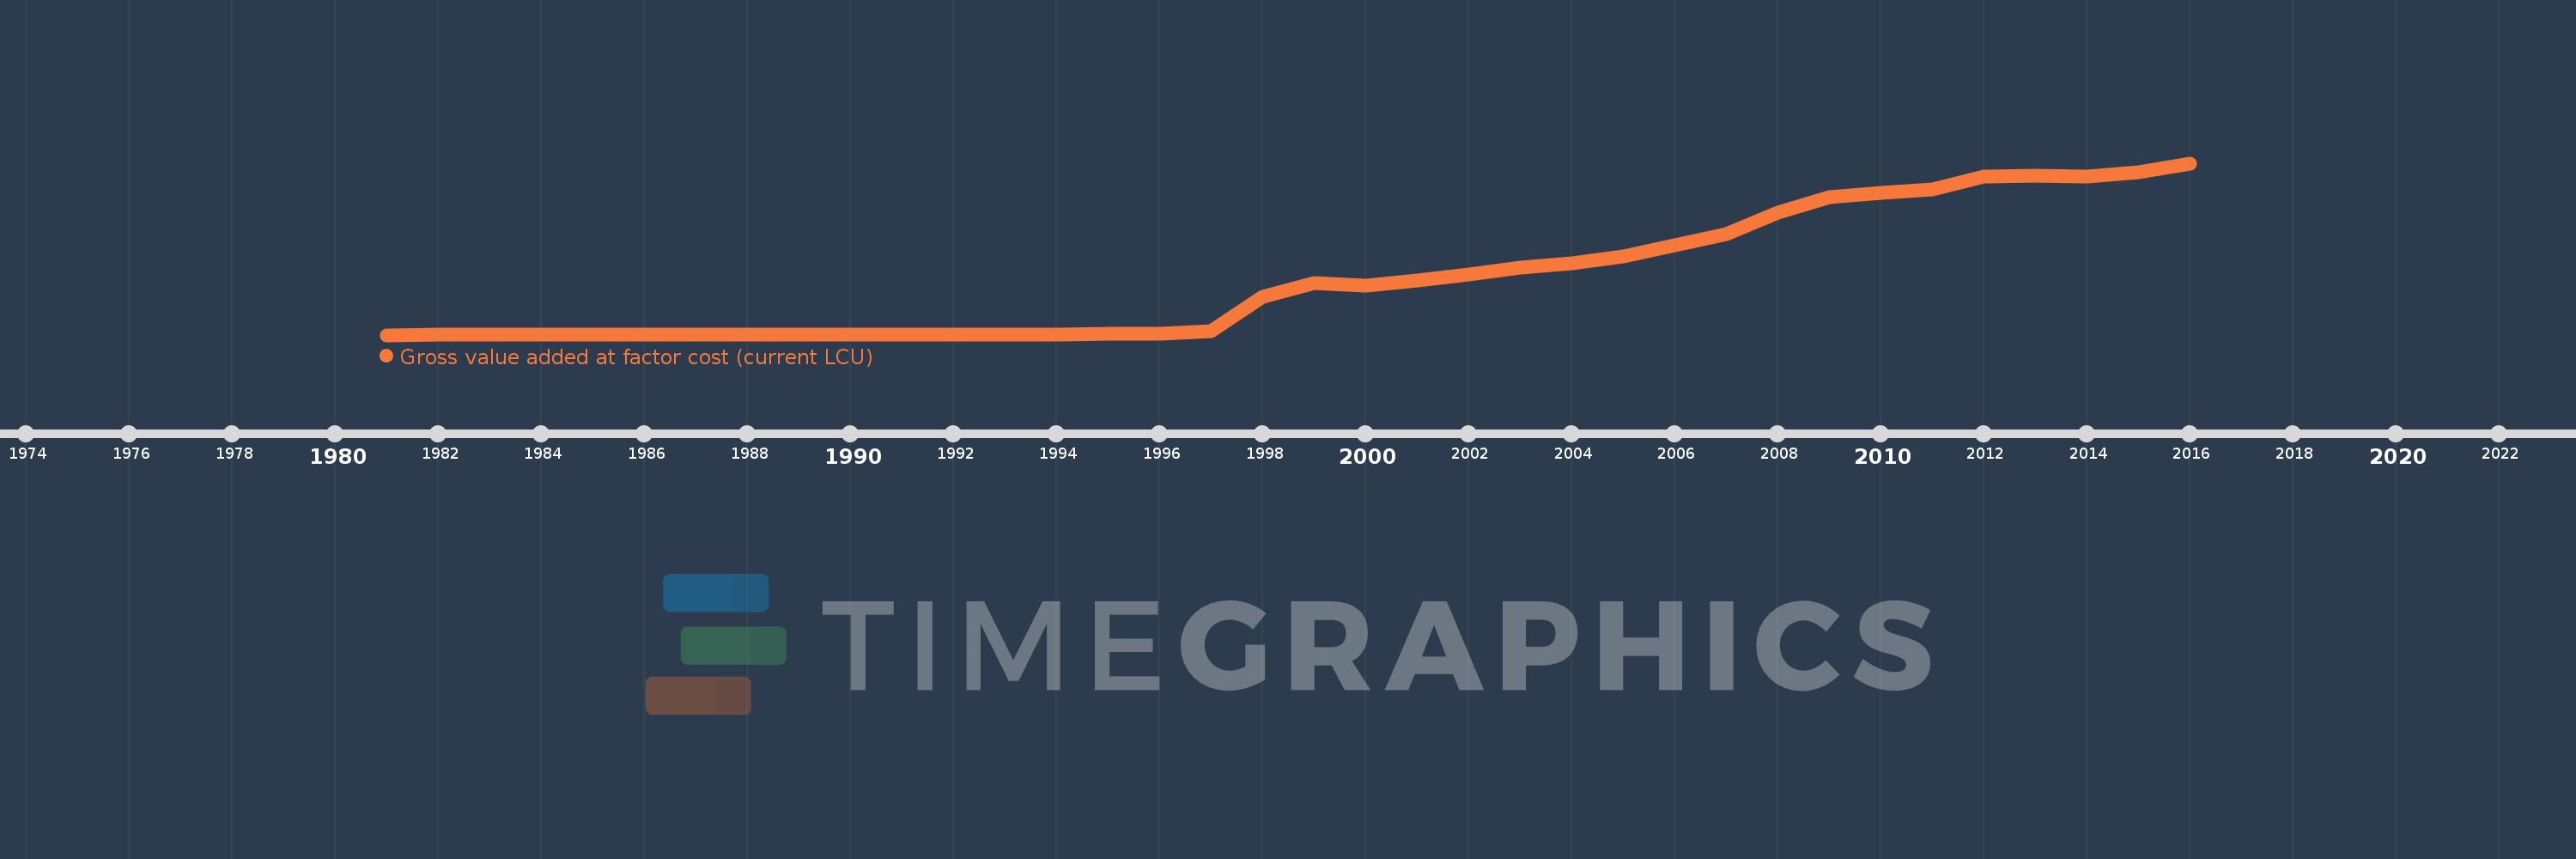
Gross value added at factor cost (current LCU)
2016,2015,2014,2013,2012,2011,2010,2009,2008,2007,2006,2005,2004,2003,2002,2001,2000,1999,1998,1997,1996,1995,1994,1993,1992,1991,1990,1989,1988,1987,1986,1985,1984,1983,1982,1981
This statistics in other country:
AfghanistanAlbaniaAlgeriaAndorraAntigua and BarbudaArgentinaArmeniaArubaAustraliaAustriaAzerbaijanBahamas, TheBahrainBangladeshBarbadosBelarusBelgiumBelizeBeninBermudaBhutanBoliviaBosnia and HerzegovinaBotswanaBrazilBulgariaBurkina FasoBurundiCabo VerdeCambodiaCameroonCanadaCayman IslandsCentral African RepublicChadChileColombiaCongo, Dem. Rep.Costa RicaCroatiaCubaCyprusCzech RepublicDenmarkDjiboutiDominicaDominican RepublicEcuadorEgypt, Arab Rep.El SalvadorEquatorial GuineaEritreaEstoniaEthiopiaFaroe IslandsFijiFinlandFranceGabonGambia, TheGeorgiaGermanyGhanaGreeceGrenadaGuatemalaGuineaGuinea-BissauGuyanaHondurasHong Kong SAR, ChinaHungaryIcelandIndiaIndonesiaIran, Islamic Rep.IrelandItalyJamaicaJapanJordanKazakhstanKenyaKiribatiKorea, Rep.KosovoKuwaitKyrgyz RepublicLao PDRLatviaLebanonLesothoLiberiaLibyaLiechtensteinLithuaniaLuxembourgMacao SAR, ChinaMacedonia, FYRMadagascarMalawiMalaysiaMaldivesMaliMaltaMarshall IslandsMauritaniaMauritiusMexicoMicronesia, Fed. Sts.MoldovaMongoliaMontenegroMoroccoMozambiqueNamibiaNepalNetherlandsNew ZealandNicaraguaNigeriaNorwayOmanPakistanPalauPanamaPapua New GuineaParaguayPeruPolandPortugalRomaniaRussian FederationRwandaSao Tome and PrincipeSenegalSerbiaSeychellesSierra LeoneSingaporeSlovak RepublicSloveniaSolomon IslandsSomaliaSouth AfricaSpainSri LankaSt. Kitts and NevisSt. LuciaSt. Vincent and the GrenadinesSudanSurinameSwazilandSwedenSwitzerlandSyrian Arab RepublicTajikistanTanzaniaThailandTimor-LesteTongaTrinidad and TobagoTunisiaTurkeyTurkmenistanTuvaluUgandaUkraineUnited KingdomUnited StatesUruguayUzbekistanVanuatuVenezuela, RBVietnamWest Bank and GazaYemen, Rep.ZambiaZimbabwe Timeline:
This timeline shows a graph from 1981 to 2016 of Bulgaria. No data until 1980. Number of actual observations by date: 36.
Source name:
World Development Indicators
Source organization:
World Bank national accounts data, and OECD National Accounts data files.
Categories, topics:
Economy & Growth
Last updated:
apr 23, 2017
Indicators value changes by year
Minimum:
25.452 mln
jan 1, 1981
Maximum:
76.546 bln
jan 1, 2016
At the date of observation
Value
Absolute change
Change from previous value
jan 1, 1981
25.452 mln
+25.452 mln
0.0%
jan 1, 1982
27.141 mln
+1.69 mln
6.64%
jan 1, 1983
29.035 mln
+1.893 mln
6.98%
jan 1, 1984
29.783 mln
+748.7K
2.58%
jan 1, 1985
31.62 mln
+1.837 mln
6.17%
jan 1, 1986
32.444 mln
+824.2K
2.61%
jan 1, 1987
33.838 mln
+1.394 mln
4.3%
jan 1, 1988
37.743 mln
+3.905 mln
11.54%
jan 1, 1989
40.226 mln
+2.483 mln
6.58%
jan 1, 1990
40.797 mln
+570.4K
1.42%
jan 1, 1991
47.308 mln
+6.511 mln
15.96%
jan 1, 1992
123.274 mln
+75.966 mln
160.58%
jan 1, 1993
180.298 mln
+57.024 mln
46.26%
jan 1, 1994
262.766 mln
+82.468 mln
45.74%
jan 1, 1995
452.663 mln
+189.897 mln
72.27%
jan 1, 1996
779.916 mln
+327.253 mln
72.3%
jan 1, 1997
1.617 bln
+836.903 mln
107.31%
jan 1, 1998
17.17 bln
+15.553 bln
961.93%
jan 1, 1999
22.99 bln
+5.821 bln
33.9%
jan 1, 2000
22.0 bln
-990.959 mln
-4.31%
jan 1, 2001
24.501 bln
+2.502 bln
11.37%
jan 1, 2002
27.184 bln
+2.683 bln
10.95%
jan 1, 2003
30.251 bln
+3.066 bln
11.28%
jan 1, 2004
31.824 bln
+1.573 bln
5.2%
jan 1, 2005
35.159 bln
+3.335 bln
10.48%
jan 1, 2006
39.953 bln
+4.794 bln
13.64%
jan 1, 2007
45.131 bln
+5.179 bln
12.96%
jan 1, 2008
54.36 bln
+9.229 bln
20.45%
jan 1, 2009
61.533 bln
+7.172 bln
13.19%
jan 1, 2010
63.218 bln
+1.685 bln
2.74%
jan 1, 2011
65.022 bln
+1.805 bln
2.85%
jan 1, 2012
70.625 bln
+5.602 bln
8.62%
jan 1, 2013
70.989 bln
+363.962 mln
0.52%
jan 1, 2014
70.771 bln
-218.061 mln
-0.31%
jan 1, 2015
72.61 bln
+1.839 bln
2.6%
jan 1, 2016
76.546 bln
+3.936 bln
5.42%
Ranking of countries by current statistics by years


Comments: