29
/
en
AIzaSyAYiBZKx7MnpbEhh9jyipgxe19OcubqV5w
April 1, 2024
109752
Congo, Dem. Rep.
COD
true
2
1
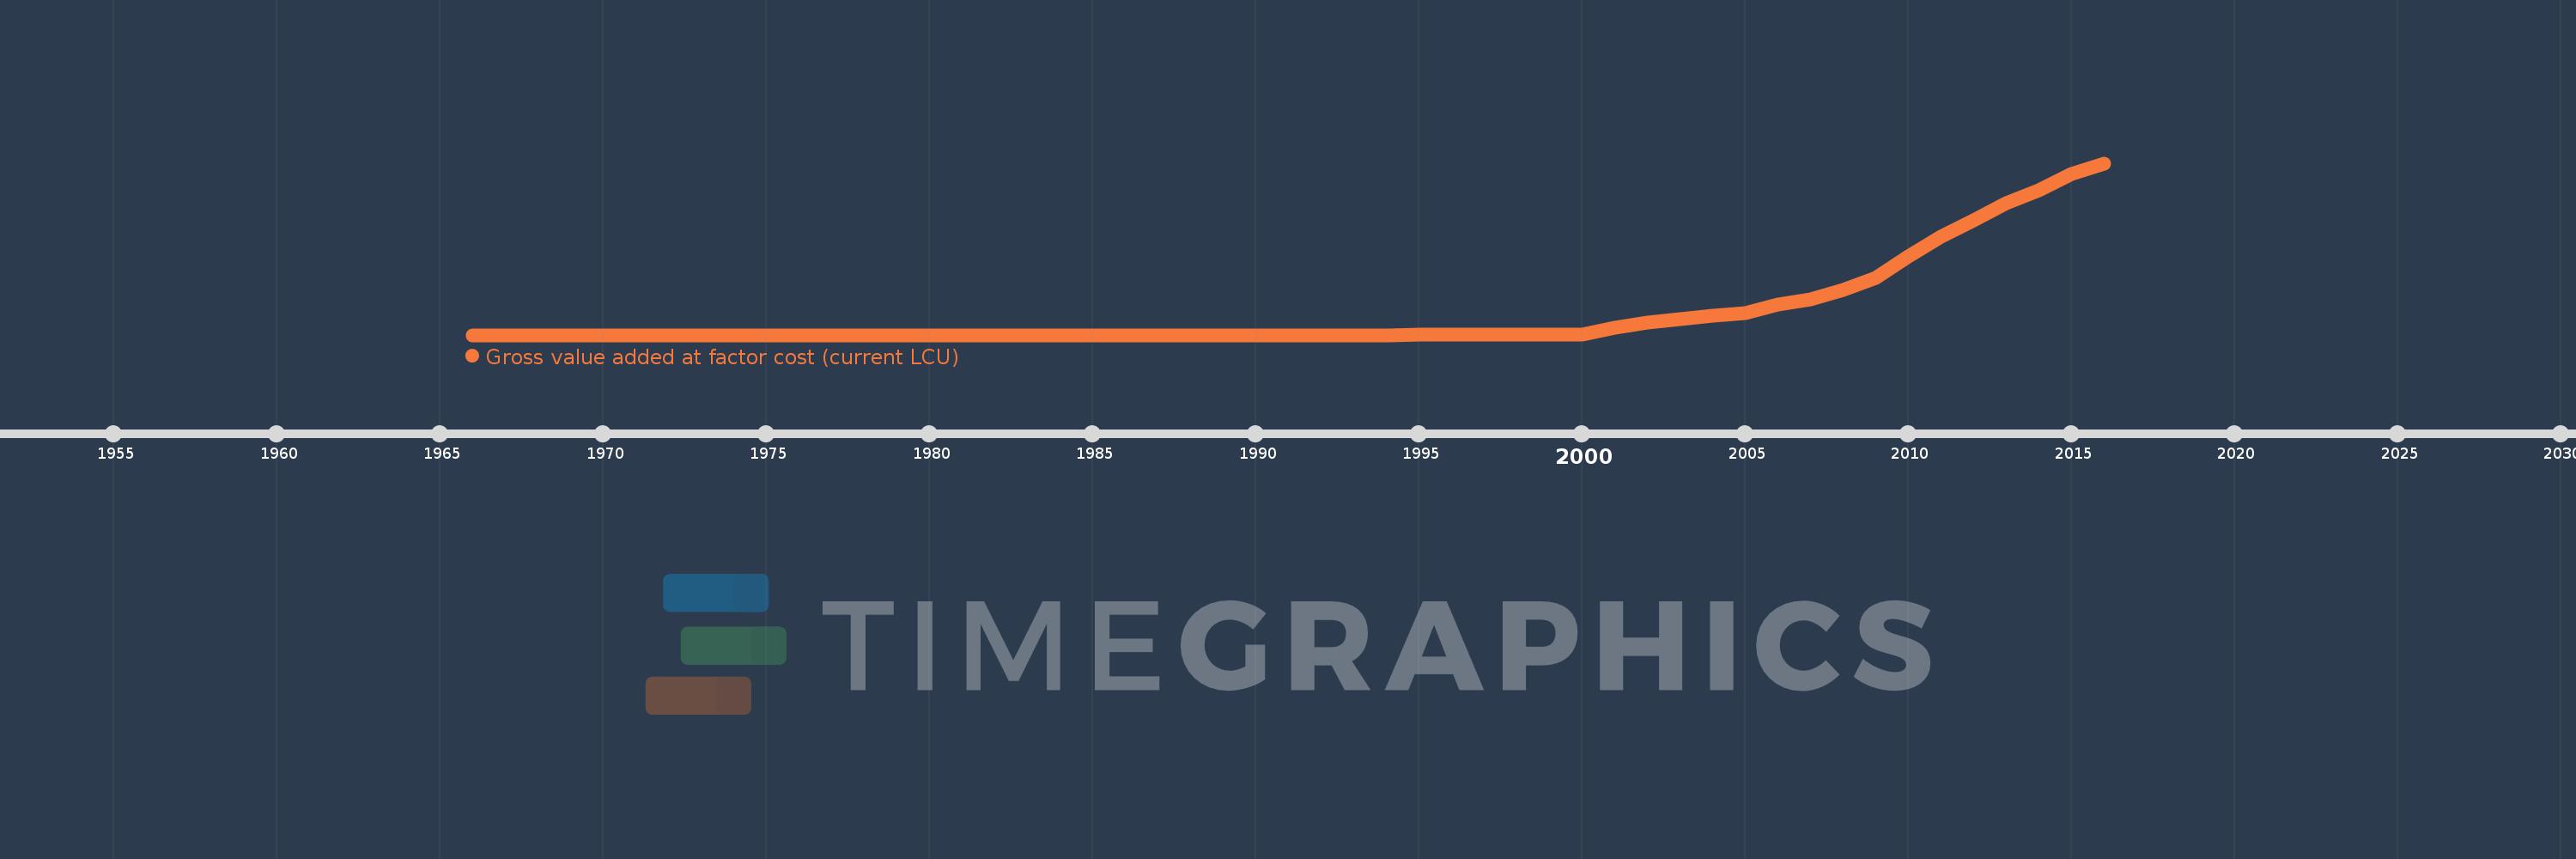
Gross value added at factor cost (current LCU)
2016,2015,2014,2013,2012,2011,2010,2009,2008,2007,2006,2005,2004,2003,2002,2001,2000,1999,1998,1997,1996,1995,1994,1993,1992,1991,1990,1989,1988,1987,1986,1985,1984,1983,1982,1981,1980,1979,1978,1977,1976,1975,1974,1973,1972,1971,1970,1969,1968,1967,1966
This statistics in other country:
AfghanistanAlbaniaAlgeriaAndorraAntigua and BarbudaArgentinaArmeniaArubaAustraliaAustriaAzerbaijanBahamas, TheBahrainBangladeshBarbadosBelarusBelgiumBelizeBeninBermudaBhutanBoliviaBosnia and HerzegovinaBotswanaBrazilBulgariaBurkina FasoBurundiCabo VerdeCambodiaCameroonCanadaCayman IslandsCentral African RepublicChadChileColombiaCongo, Dem. Rep.Costa RicaCroatiaCubaCyprusCzech RepublicDenmarkDjiboutiDominicaDominican RepublicEcuadorEgypt, Arab Rep.El SalvadorEquatorial GuineaEritreaEstoniaEthiopiaFaroe IslandsFijiFinlandFranceGabonGambia, TheGeorgiaGermanyGhanaGreeceGrenadaGuatemalaGuineaGuinea-BissauGuyanaHondurasHong Kong SAR, ChinaHungaryIcelandIndiaIndonesiaIran, Islamic Rep.IrelandItalyJamaicaJapanJordanKazakhstanKenyaKiribatiKorea, Rep.KosovoKuwaitKyrgyz RepublicLao PDRLatviaLebanonLesothoLiberiaLibyaLiechtensteinLithuaniaLuxembourgMacao SAR, ChinaMacedonia, FYRMadagascarMalawiMalaysiaMaldivesMaliMaltaMarshall IslandsMauritaniaMauritiusMexicoMicronesia, Fed. Sts.MoldovaMongoliaMontenegroMoroccoMozambiqueNamibiaNepalNetherlandsNew ZealandNicaraguaNigeriaNorwayOmanPakistanPalauPanamaPapua New GuineaParaguayPeruPolandPortugalRomaniaRussian FederationRwandaSao Tome and PrincipeSenegalSerbiaSeychellesSierra LeoneSingaporeSlovak RepublicSloveniaSolomon IslandsSomaliaSouth AfricaSpainSri LankaSt. Kitts and NevisSt. LuciaSt. Vincent and the GrenadinesSudanSurinameSwazilandSwedenSwitzerlandSyrian Arab RepublicTajikistanTanzaniaThailandTimor-LesteTongaTrinidad and TobagoTunisiaTurkeyTurkmenistanTuvaluUgandaUkraineUnited KingdomUnited StatesUruguayUzbekistanVanuatuVenezuela, RBVietnamWest Bank and GazaYemen, Rep.ZambiaZimbabwe Timeline:
This timeline shows a graph from 1966 to 2016 of Congo, Dem. Rep.. No data until 1965. Number of actual observations by date: 51.
Source name:
World Development Indicators
Source organization:
World Bank national accounts data, and OECD National Accounts data files.
Categories, topics:
Economy & Growth
Last updated:
apr 23, 2017
Indicators value changes by year
Maximum:
31.019 trl
jan 1, 2016
At the date of observation
Value
Absolute change
Change from previous value
jan 1, 1966
0.002
+0.002
0.0%
jan 1, 1967
0.002
+0.0
12.09%
jan 1, 1968
0.004
+0.001
57.01%
jan 1, 1969
0.007
+0.003
66.81%
jan 1, 1970
0.008
+0.002
28.71%
jan 1, 1971
0.007
-0.001
-11.46%
jan 1, 1972
0.009
+0.001
14.64%
jan 1, 1973
0.009
+0.001
10.09%
jan 1, 1974
0.012
+0.003
28.23%
jan 1, 1975
0.015
+0.003
23.22%
jan 1, 1976
0.016
+0.001
7.38%
jan 1, 1977
0.024
+0.008
52.54%
jan 1, 1978
0.034
+0.01
39.9%
jan 1, 1979
0.041
+0.007
21.97%
jan 1, 1980
0.084
+0.042
101.59%
jan 1, 1981
0.127
+0.043
51.73%
jan 1, 1982
0.174
+0.048
37.5%
jan 1, 1983
0.251
+0.076
43.65%
jan 1, 1984
0.453
+0.202
80.67%
jan 1, 1985
0.898
+0.445
98.32%
jan 1, 1986
1.125
+0.227
25.26%
jan 1, 1987
1.513
+0.388
34.51%
jan 1, 1988
2.8
+1.287
85.09%
jan 1, 1989
5.365
+2.566
91.63%
jan 1, 1990
11.164
+5.799
108.07%
jan 1, 1991
21.801
+10.637
95.28%
jan 1, 1992
468.304
+446.503
2.05K%
jan 1, 1993
17.513K
+17.045K
3.64K%
jan 1, 1994
267.085K
+249.571K
1.43K%
jan 1, 1995
68.946 mln
+68.679 mln
25.71K%
jan 1, 1996
393.25 mln
+324.304 mln
470.37%
jan 1, 1997
2.871 bln
+2.478 bln
630.17%
jan 1, 1998
7.894 bln
+5.023 bln
174.92%
jan 1, 1999
9.783 bln
+1.889 bln
23.93%
jan 1, 2000
51.5 bln
+41.717 bln
426.41%
jan 1, 2001
1.302 trl
+1.251 trl
2.43K%
jan 1, 2002
2.174 trl
+871.682 bln
66.93%
jan 1, 2003
2.943 trl
+768.649 bln
35.35%
jan 1, 2004
3.511 trl
+568.161 bln
19.31%
jan 1, 2005
3.942 trl
+431.328 bln
12.29%
jan 1, 2006
5.467 trl
+1.525 trl
38.67%
jan 1, 2007
6.426 trl
+958.802 bln
17.54%
jan 1, 2008
8.178 trl
+1.752 trl
27.27%
jan 1, 2009
10.358 trl
+2.18 trl
26.65%
jan 1, 2010
14.207 trl
+3.849 trl
37.16%
jan 1, 2011
17.752 trl
+3.545 trl
24.95%
jan 1, 2012
20.757 trl
+3.005 trl
16.93%
jan 1, 2013
23.857 trl
+3.1 trl
14.93%
jan 1, 2014
26.199 trl
+2.342 trl
9.82%
jan 1, 2015
29.004 trl
+2.805 trl
10.71%
jan 1, 2016
31.019 trl
+2.015 trl
6.95%
Ranking of countries by current statistics by years


Comments: