29
/
en
AIzaSyAYiBZKx7MnpbEhh9jyipgxe19OcubqV5w
April 1, 2024
283692
West Bank and Gaza
PSE
true
2
1
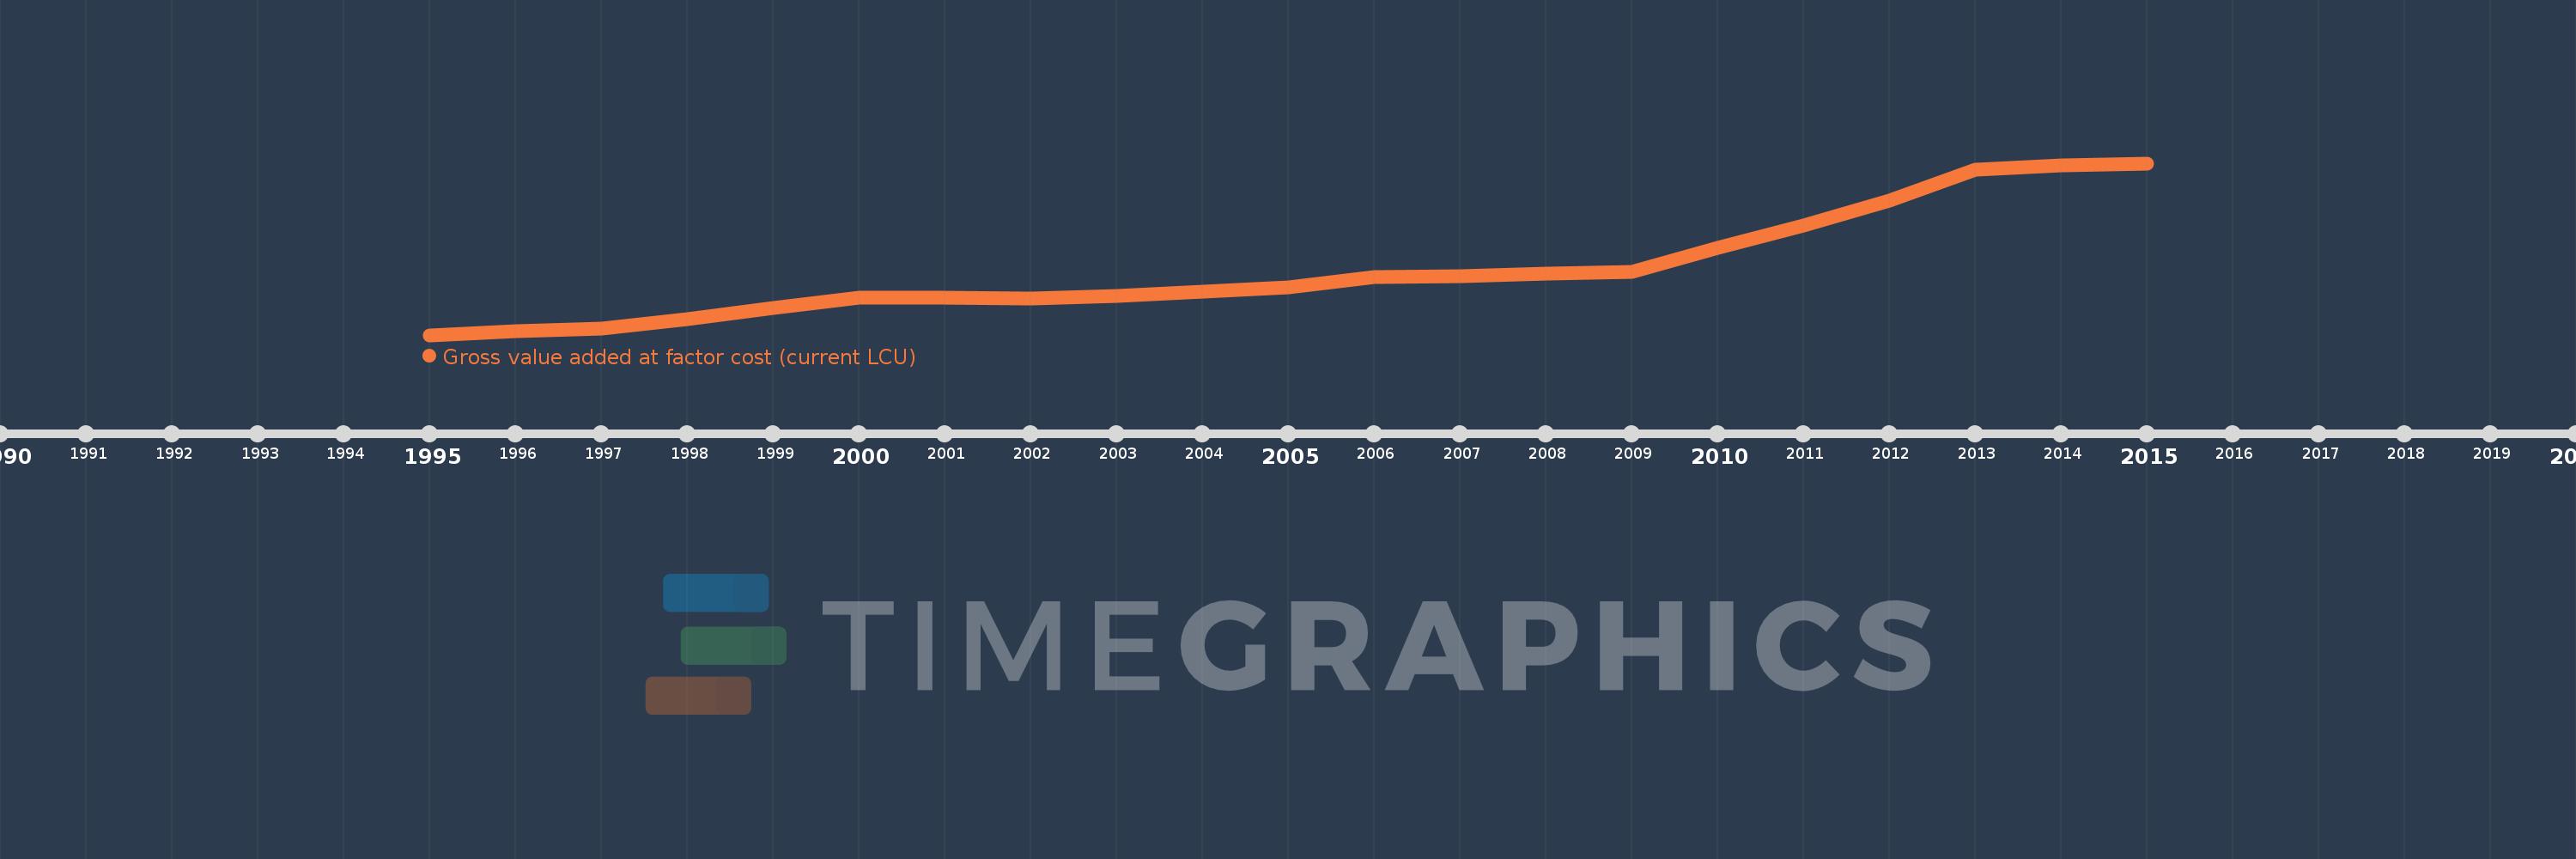
Gross value added at factor cost (current LCU)
2015,2014,2013,2012,2011,2010,2009,2008,2007,2006,2005,2004,2003,2002,2001,2000,1999,1998,1997,1996,1995
This statistics in other country:
AfghanistanAlbaniaAlgeriaAndorraAntigua and BarbudaArgentinaArmeniaArubaAustraliaAustriaAzerbaijanBahamas, TheBahrainBangladeshBarbadosBelarusBelgiumBelizeBeninBermudaBhutanBoliviaBosnia and HerzegovinaBotswanaBrazilBulgariaBurkina FasoBurundiCabo VerdeCambodiaCameroonCanadaCayman IslandsCentral African RepublicChadChileColombiaCongo, Dem. Rep.Costa RicaCroatiaCubaCyprusCzech RepublicDenmarkDjiboutiDominicaDominican RepublicEcuadorEgypt, Arab Rep.El SalvadorEquatorial GuineaEritreaEstoniaEthiopiaFaroe IslandsFijiFinlandFranceGabonGambia, TheGeorgiaGermanyGhanaGreeceGrenadaGuatemalaGuineaGuinea-BissauGuyanaHondurasHong Kong SAR, ChinaHungaryIcelandIndiaIndonesiaIran, Islamic Rep.IrelandItalyJamaicaJapanJordanKazakhstanKenyaKiribatiKorea, Rep.KosovoKuwaitKyrgyz RepublicLao PDRLatviaLebanonLesothoLiberiaLibyaLiechtensteinLithuaniaLuxembourgMacao SAR, ChinaMacedonia, FYRMadagascarMalawiMalaysiaMaldivesMaliMaltaMarshall IslandsMauritaniaMauritiusMexicoMicronesia, Fed. Sts.MoldovaMongoliaMontenegroMoroccoMozambiqueNamibiaNepalNetherlandsNew ZealandNicaraguaNigeriaNorwayOmanPakistanPalauPanamaPapua New GuineaParaguayPeruPolandPortugalRomaniaRussian FederationRwandaSao Tome and PrincipeSenegalSerbiaSeychellesSierra LeoneSingaporeSlovak RepublicSloveniaSolomon IslandsSomaliaSouth AfricaSpainSri LankaSt. Kitts and NevisSt. LuciaSt. Vincent and the GrenadinesSudanSurinameSwazilandSwedenSwitzerlandSyrian Arab RepublicTajikistanTanzaniaThailandTimor-LesteTongaTrinidad and TobagoTunisiaTurkeyTurkmenistanTuvaluUgandaUkraineUnited KingdomUnited StatesUruguayUzbekistanVanuatuVenezuela, RBVietnamWest Bank and GazaYemen, Rep.ZambiaZimbabwe Timeline:
This timeline shows a graph from 1995 to 2015 of West Bank and Gaza. No data until 1994. Number of actual observations by date: 21.
Source name:
World Development Indicators
Source organization:
World Bank national accounts data, and OECD National Accounts data files.
Categories, topics:
Economy & Growth
Last updated:
apr 23, 2017
Indicators value changes by year
Minimum:
8.501 bln
jan 1, 1995
Maximum:
39.105 bln
jan 1, 2015
At the date of observation
Value
Absolute change
Change from previous value
jan 1, 1995
8.501 bln
+8.501 bln
0.0%
jan 1, 1996
9.141 bln
+639.864 mln
7.53%
jan 1, 1997
9.711 bln
+569.964 mln
6.24%
jan 1, 1998
11.308 bln
+1.597 bln
16.45%
jan 1, 1999
13.372 bln
+2.064 bln
18.25%
jan 1, 2000
15.203 bln
+1.831 bln
13.69%
jan 1, 2001
15.149 bln
-54.248 mln
-0.36%
jan 1, 2002
15.049 bln
-99.965 mln
-0.66%
jan 1, 2003
15.431 bln
+381.705 mln
2.54%
jan 1, 2004
16.278 bln
+847.084 mln
5.49%
jan 1, 2005
17.041 bln
+763.387 mln
4.69%
jan 1, 2006
18.76 bln
+1.719 bln
10.09%
jan 1, 2007
19.018 bln
+257.865 mln
1.37%
jan 1, 2008
19.515 bln
+496.462 mln
2.61%
jan 1, 2009
19.725 bln
+209.819 mln
1.08%
jan 1, 2010
23.99 bln
+4.265 bln
21.62%
jan 1, 2011
27.947 bln
+3.958 bln
16.5%
jan 1, 2012
32.441 bln
+4.493 bln
16.08%
jan 1, 2013
37.994 bln
+5.553 bln
17.12%
jan 1, 2014
38.668 bln
+674.332 mln
1.77%
jan 1, 2015
39.105 bln
+437.316 mln
1.13%
Ranking of countries by current statistics by years


Comments: