29
/
en
AIzaSyAYiBZKx7MnpbEhh9jyipgxe19OcubqV5w
April 1, 2024
112329
Costa Rica
CRI
true
2
1
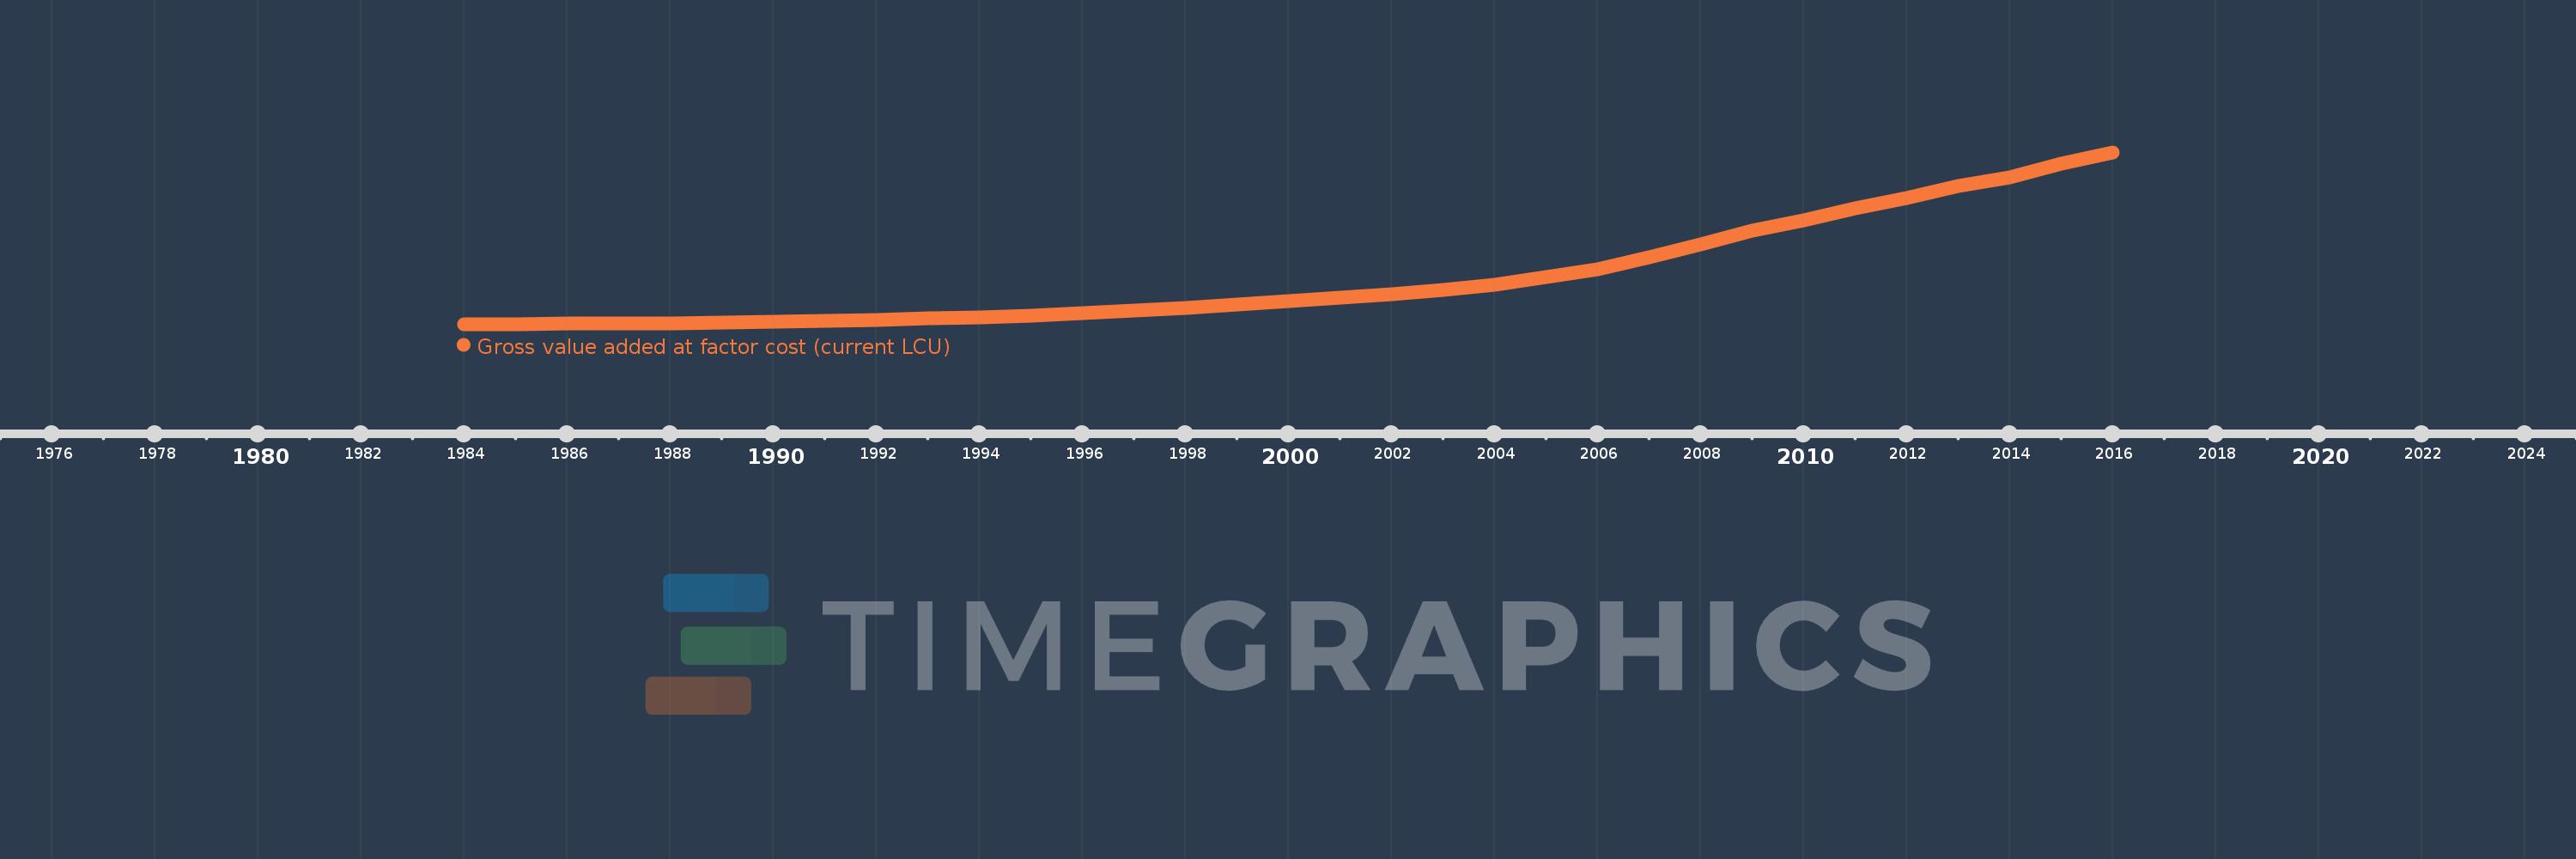
Gross value added at factor cost (current LCU)
2016,2015,2014,2013,2012,2011,2010,2009,2008,2007,2006,2005,2004,2003,2002,2001,2000,1999,1998,1997,1996,1995,1994,1993,1992,1991,1990,1989,1988,1987,1986,1985,1984
This statistics in other country:
AfghanistanAlbaniaAlgeriaAndorraAntigua and BarbudaArgentinaArmeniaArubaAustraliaAustriaAzerbaijanBahamas, TheBahrainBangladeshBarbadosBelarusBelgiumBelizeBeninBermudaBhutanBoliviaBosnia and HerzegovinaBotswanaBrazilBulgariaBurkina FasoBurundiCabo VerdeCambodiaCameroonCanadaCayman IslandsCentral African RepublicChadChileColombiaCongo, Dem. Rep.Costa RicaCroatiaCubaCyprusCzech RepublicDenmarkDjiboutiDominicaDominican RepublicEcuadorEgypt, Arab Rep.El SalvadorEquatorial GuineaEritreaEstoniaEthiopiaFaroe IslandsFijiFinlandFranceGabonGambia, TheGeorgiaGermanyGhanaGreeceGrenadaGuatemalaGuineaGuinea-BissauGuyanaHondurasHong Kong SAR, ChinaHungaryIcelandIndiaIndonesiaIran, Islamic Rep.IrelandItalyJamaicaJapanJordanKazakhstanKenyaKiribatiKorea, Rep.KosovoKuwaitKyrgyz RepublicLao PDRLatviaLebanonLesothoLiberiaLibyaLiechtensteinLithuaniaLuxembourgMacao SAR, ChinaMacedonia, FYRMadagascarMalawiMalaysiaMaldivesMaliMaltaMarshall IslandsMauritaniaMauritiusMexicoMicronesia, Fed. Sts.MoldovaMongoliaMontenegroMoroccoMozambiqueNamibiaNepalNetherlandsNew ZealandNicaraguaNigeriaNorwayOmanPakistanPalauPanamaPapua New GuineaParaguayPeruPolandPortugalRomaniaRussian FederationRwandaSao Tome and PrincipeSenegalSerbiaSeychellesSierra LeoneSingaporeSlovak RepublicSloveniaSolomon IslandsSomaliaSouth AfricaSpainSri LankaSt. Kitts and NevisSt. LuciaSt. Vincent and the GrenadinesSudanSurinameSwazilandSwedenSwitzerlandSyrian Arab RepublicTajikistanTanzaniaThailandTimor-LesteTongaTrinidad and TobagoTunisiaTurkeyTurkmenistanTuvaluUgandaUkraineUnited KingdomUnited StatesUruguayUzbekistanVanuatuVenezuela, RBVietnamWest Bank and GazaYemen, Rep.ZambiaZimbabwe Timeline:
This timeline shows a graph from 1984 to 2016 of Costa Rica. No data until 1983. Number of actual observations by date: 33.
Source name:
World Development Indicators
Source organization:
World Bank national accounts data, and OECD National Accounts data files.
Categories, topics:
Economy & Growth
Last updated:
apr 23, 2017
Indicators value changes by year
Minimum:
144.52 bln
jan 1, 1984
Maximum:
26.532 trl
jan 1, 2016
At the date of observation
Value
Absolute change
Change from previous value
jan 1, 1984
144.52 bln
+144.52 bln
0.0%
jan 1, 1985
180.473 bln
+35.953 bln
24.88%
jan 1, 1986
215.715 bln
+35.242 bln
19.53%
jan 1, 1987
271.765 bln
+56.05 bln
25.98%
jan 1, 1988
327.312 bln
+55.546 bln
20.44%
jan 1, 1989
414.171 bln
+86.859 bln
26.54%
jan 1, 1990
503.303 bln
+89.132 bln
21.52%
jan 1, 1991
612.462 bln
+109.16 bln
21.69%
jan 1, 1992
808.205 bln
+195.742 bln
31.96%
jan 1, 1993
1.045 trl
+237.094 bln
29.34%
jan 1, 1994
1.246 trl
+200.957 bln
19.22%
jan 1, 1995
1.503 trl
+256.946 bln
20.62%
jan 1, 1996
1.893 trl
+389.919 bln
25.94%
jan 1, 1997
2.196 trl
+303.304 bln
16.02%
jan 1, 1998
2.663 trl
+466.131 bln
21.22%
jan 1, 1999
3.205 trl
+542.018 bln
20.36%
jan 1, 2000
3.691 trl
+486.577 bln
15.18%
jan 1, 2001
4.171 trl
+480.142 bln
13.01%
jan 1, 2002
4.723 trl
+551.801 bln
13.23%
jan 1, 2003
5.369 trl
+645.988 bln
13.68%
jan 1, 2004
6.221 trl
+852.288 bln
15.87%
jan 1, 2005
7.366 trl
+1.145 trl
18.4%
jan 1, 2006
8.641 trl
+1.274 trl
17.3%
jan 1, 2007
10.432 trl
+1.792 trl
20.74%
jan 1, 2008
12.398 trl
+1.965 trl
18.84%
jan 1, 2009
14.482 trl
+2.084 trl
16.81%
jan 1, 2010
16.046 trl
+1.565 trl
10.8%
jan 1, 2011
17.957 trl
+1.91 trl
11.91%
jan 1, 2012
19.505 trl
+1.548 trl
8.62%
jan 1, 2013
21.382 trl
+1.877 trl
9.62%
jan 1, 2014
22.694 trl
+1.312 trl
6.14%
jan 1, 2015
24.766 trl
+2.072 trl
9.13%
jan 1, 2016
26.532 trl
+1.766 trl
7.13%
Ranking of countries by current statistics by years


Comments: