29
/
en
AIzaSyAYiBZKx7MnpbEhh9jyipgxe19OcubqV5w
April 1, 2024
170473
Korea, Rep.
KOR
true
2
1
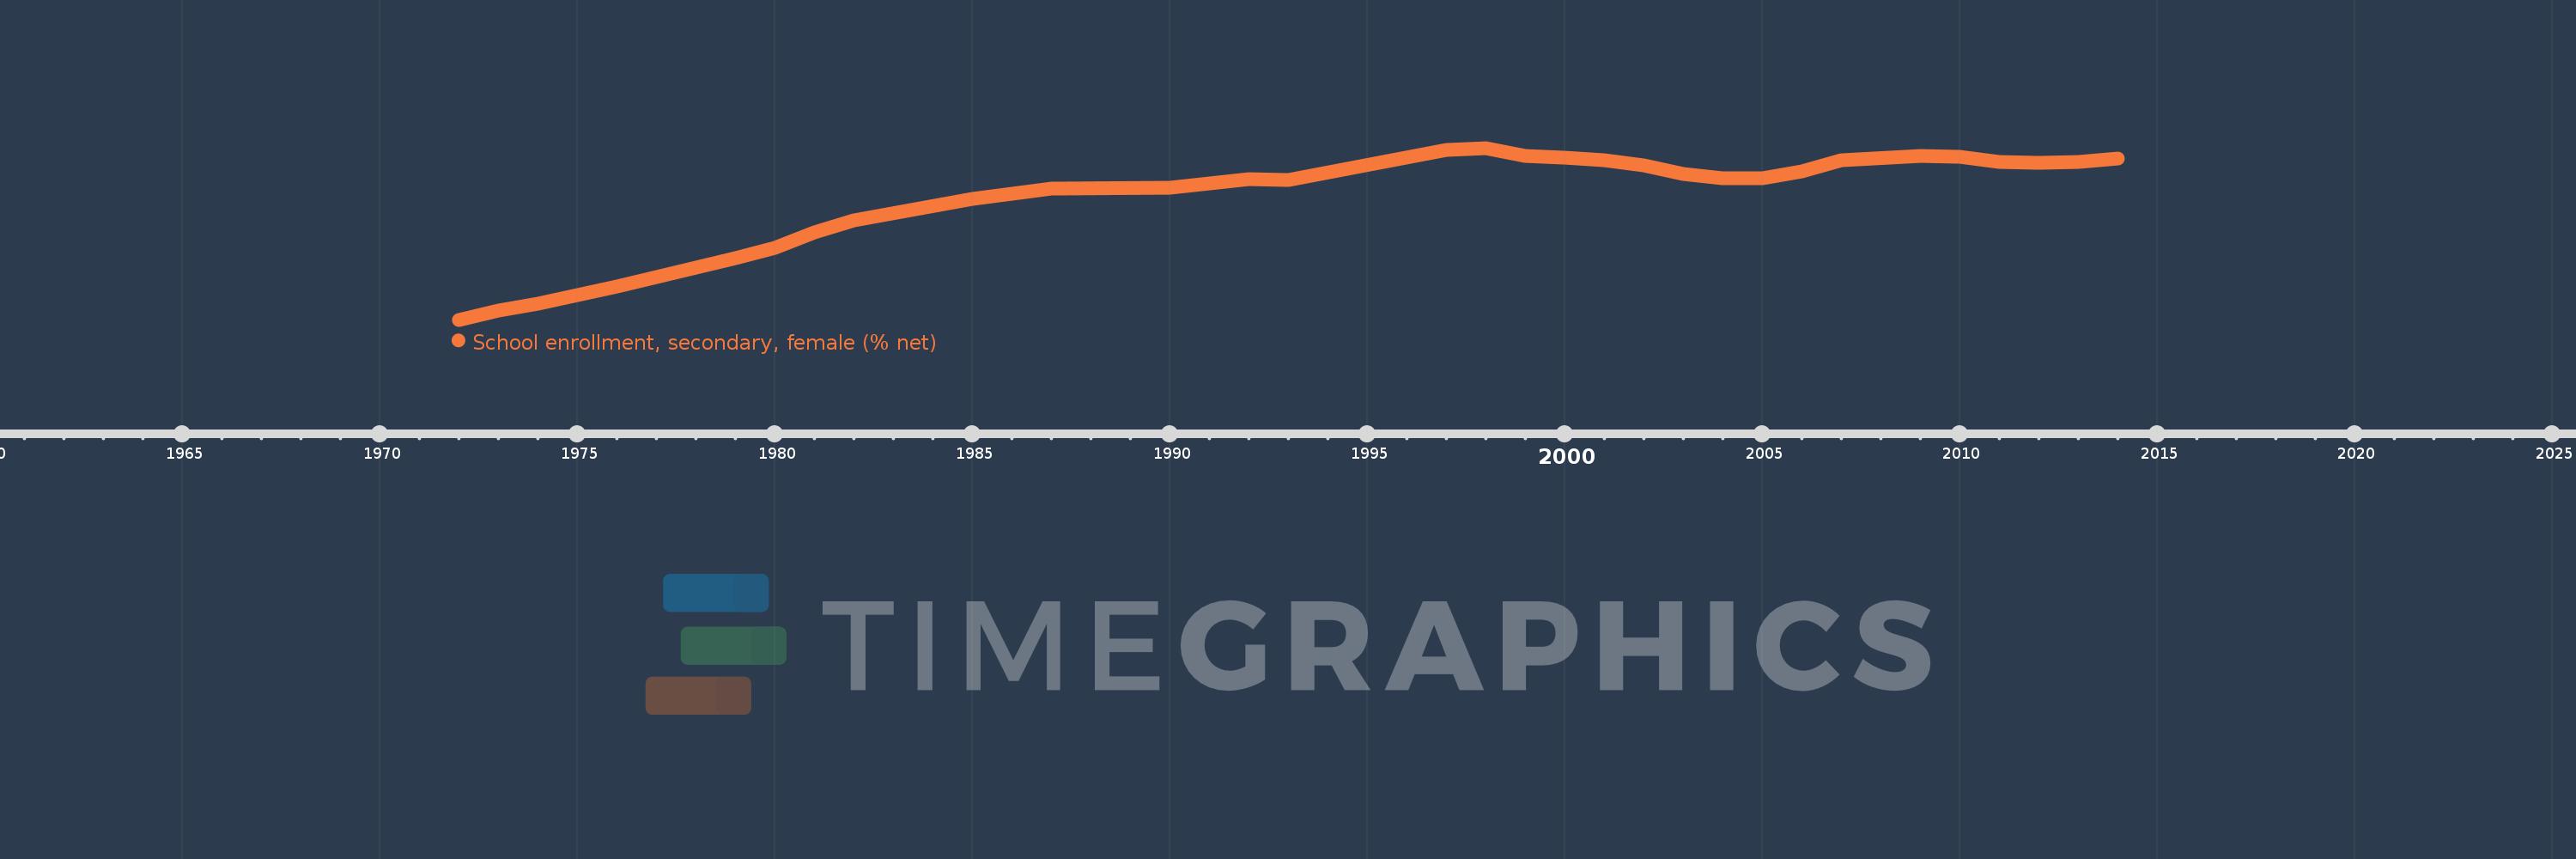
School enrollment, secondary, female (% net)
2014,2013,2012,2011,2010,2009,2007,2006,2005,2004,2003,2002,2001,2000,1999,1998,1997,1993,1992,1990,1987,1986,1985,1982,1981,1980,1979,1978,1977,1976,1975,1974,1973,1972
This statistics in other country:
AfghanistanAlbaniaAlgeriaAngolaAntigua and BarbudaArab WorldArgentinaArmeniaArubaAustraliaAzerbaijanBahamas, TheBahrainBangladeshBarbadosBelarusBelgiumBelizeBeninBermudaBhutanBoliviaBotswanaBrazilBrunei DarussalamBulgariaBurkina FasoBurundiCabo VerdeCambodiaCameroonCanadaCaribbean small statesCentral African RepublicCentral Europe and the BalticsChadChileColombiaComorosCongo, Dem. Rep.Congo, Rep.Costa RicaCroatiaCubaCyprusDenmarkDjiboutiDominicaDominican RepublicEarly-demographic dividendEast Asia & PacificEast Asia & Pacific (excluding high income)East Asia & Pacific (IDA & IBRD countries)EcuadorEgypt, Arab Rep.El SalvadorEquatorial GuineaEritreaEstoniaEthiopiaEuro areaEurope & Central AsiaEurope & Central Asia (excluding high income)Europe & Central Asia (IDA & IBRD countries)European UnionFijiFinlandFragile and conflict affected situationsFranceGambia, TheGeorgiaGhanaGreeceGrenadaGuatemalaGuineaGuinea-BissauGuyanaHeavily indebted poor countries (HIPC)High incomeHondurasHong Kong SAR, ChinaHungaryIBRD onlyIcelandIDA & IBRD totalIDA blendIDA onlyIDA totalIndiaIndonesiaIran, Islamic Rep.IraqIrelandIsraelItalyJamaicaJapanJordanKazakhstanKenyaKiribatiKorea, Rep.KuwaitKyrgyz RepublicLao PDRLate-demographic dividendLatin America & Caribbean Latin America & Caribbean (excluding high income)Latin America & the Caribbean (IDA & IBRD countries)LatviaLeast developed countries: UN classificationLebanonLesothoLibyaLiechtensteinLithuaniaLow & middle incomeLow incomeLower middle incomeLuxembourgMacao SAR, ChinaMacedonia, FYRMadagascarMalawiMaldivesMaliMaltaMarshall IslandsMauritaniaMauritiusMexicoMiddle East & North AfricaMiddle East & North Africa (excluding high income)Middle East & North Africa (IDA & IBRD countries)Middle incomeMoldovaMongoliaMoroccoMozambiqueMyanmarNamibiaNauruNepalNetherlandsNew ZealandNicaraguaNigerNorth AmericaNorwayOECD membersOmanOther small statesPacific island small statesPakistanPanamaParaguayPeruPhilippinesPolandPortugalPost-demographic dividendPre-demographic dividendPuerto RicoQatarRomaniaSamoaSao Tome and PrincipeSaudi ArabiaSenegalSerbiaSeychellesSierra LeoneSloveniaSmall statesSolomon IslandsSomaliaSouth AfricaSouth AsiaSouth Asia (IDA & IBRD)SpainSri LankaSt. Kitts and NevisSt. LuciaSt. Vincent and the GrenadinesSub-Saharan Africa Sub-Saharan Africa (excluding high income)Sub-Saharan Africa (IDA & IBRD countries)SurinameSwazilandSwedenSwitzerlandSyrian Arab RepublicTajikistanThailandTimor-LesteTogoTongaTrinidad and TobagoTunisiaTurkeyTuvaluUgandaUkraineUnited Arab EmiratesUnited KingdomUnited StatesUpper middle incomeUruguayVanuatuVenezuela, RBWest Bank and GazaWorldYemen, Rep.Zimbabwe Timeline:
This timeline shows a graph from 1972 to 2014 of Korea, Rep.. No data until 1971. Number of actual observations by date: 34.
Source name:
World Development Indicators
Source organization:
United Nations Educational, Scientific, and Cultural Organization (UNESCO) Institute for Statistics.
Categories, topics:
Education, Gender
Last updated:
apr 23, 2017
Indicators value changes by year
Minimum:
28.667
jan 1, 1972
At the date of observation
Value
Absolute change
Change from previous value
jan 1, 1972
28.667
+28.667
0.0%
jan 1, 1973
32.316
+3.65
12.73%
jan 1, 1974
35.471
+3.155
9.76%
jan 1, 1975
38.858
+3.386
9.55%
jan 1, 1976
42.501
+3.644
9.38%
jan 1, 1977
46.395
+3.894
9.16%
jan 1, 1978
50.463
+4.067
8.77%
jan 1, 1979
54.247
+3.784
7.5%
jan 1, 1980
58.529
+4.282
7.89%
jan 1, 1981
64.924
+6.395
10.93%
jan 1, 1982
69.939
+5.016
7.73%
jan 1, 1985
78.707
+8.768
12.54%
jan 1, 1986
81.029
+2.322
2.95%
jan 1, 1987
83.242
+2.212
2.73%
jan 1, 1990
83.578
+0.336
0.4%
jan 1, 1992
86.92
+3.343
4.0%
jan 1, 1993
86.799
-0.121
-0.14%
jan 1, 1997
99.072
+12.273
14.14%
jan 1, 1998
100.0
+0.928
0.94%
jan 1, 1999
96.851
-3.149
-3.15%
jan 1, 2000
95.797
-1.055
-1.09%
jan 1, 2001
94.868
-0.928
-0.97%
jan 1, 2002
92.905
-1.964
-2.07%
jan 1, 2003
89.159
-3.745
-4.03%
jan 1, 2004
87.266
-1.894
-2.12%
jan 1, 2005
87.233
-0.033
-0.04%
jan 1, 2006
90.279
+3.047
3.49%
jan 1, 2007
94.849
+4.57
5.06%
jan 1, 2009
96.842
+1.993
2.1%
jan 1, 2010
96.154
-0.688
-0.71%
jan 1, 2011
94.35
-1.804
-1.88%
jan 1, 2012
93.867
-0.483
-0.51%
jan 1, 2013
94.288
+0.421
0.45%
jan 1, 2014
95.685
+1.396
1.48%
Ranking of countries by current statistics by years


Comments: