29
/
en
AIzaSyAYiBZKx7MnpbEhh9jyipgxe19OcubqV5w
April 1, 2024
53790
Other small states
OSS
false
2
1
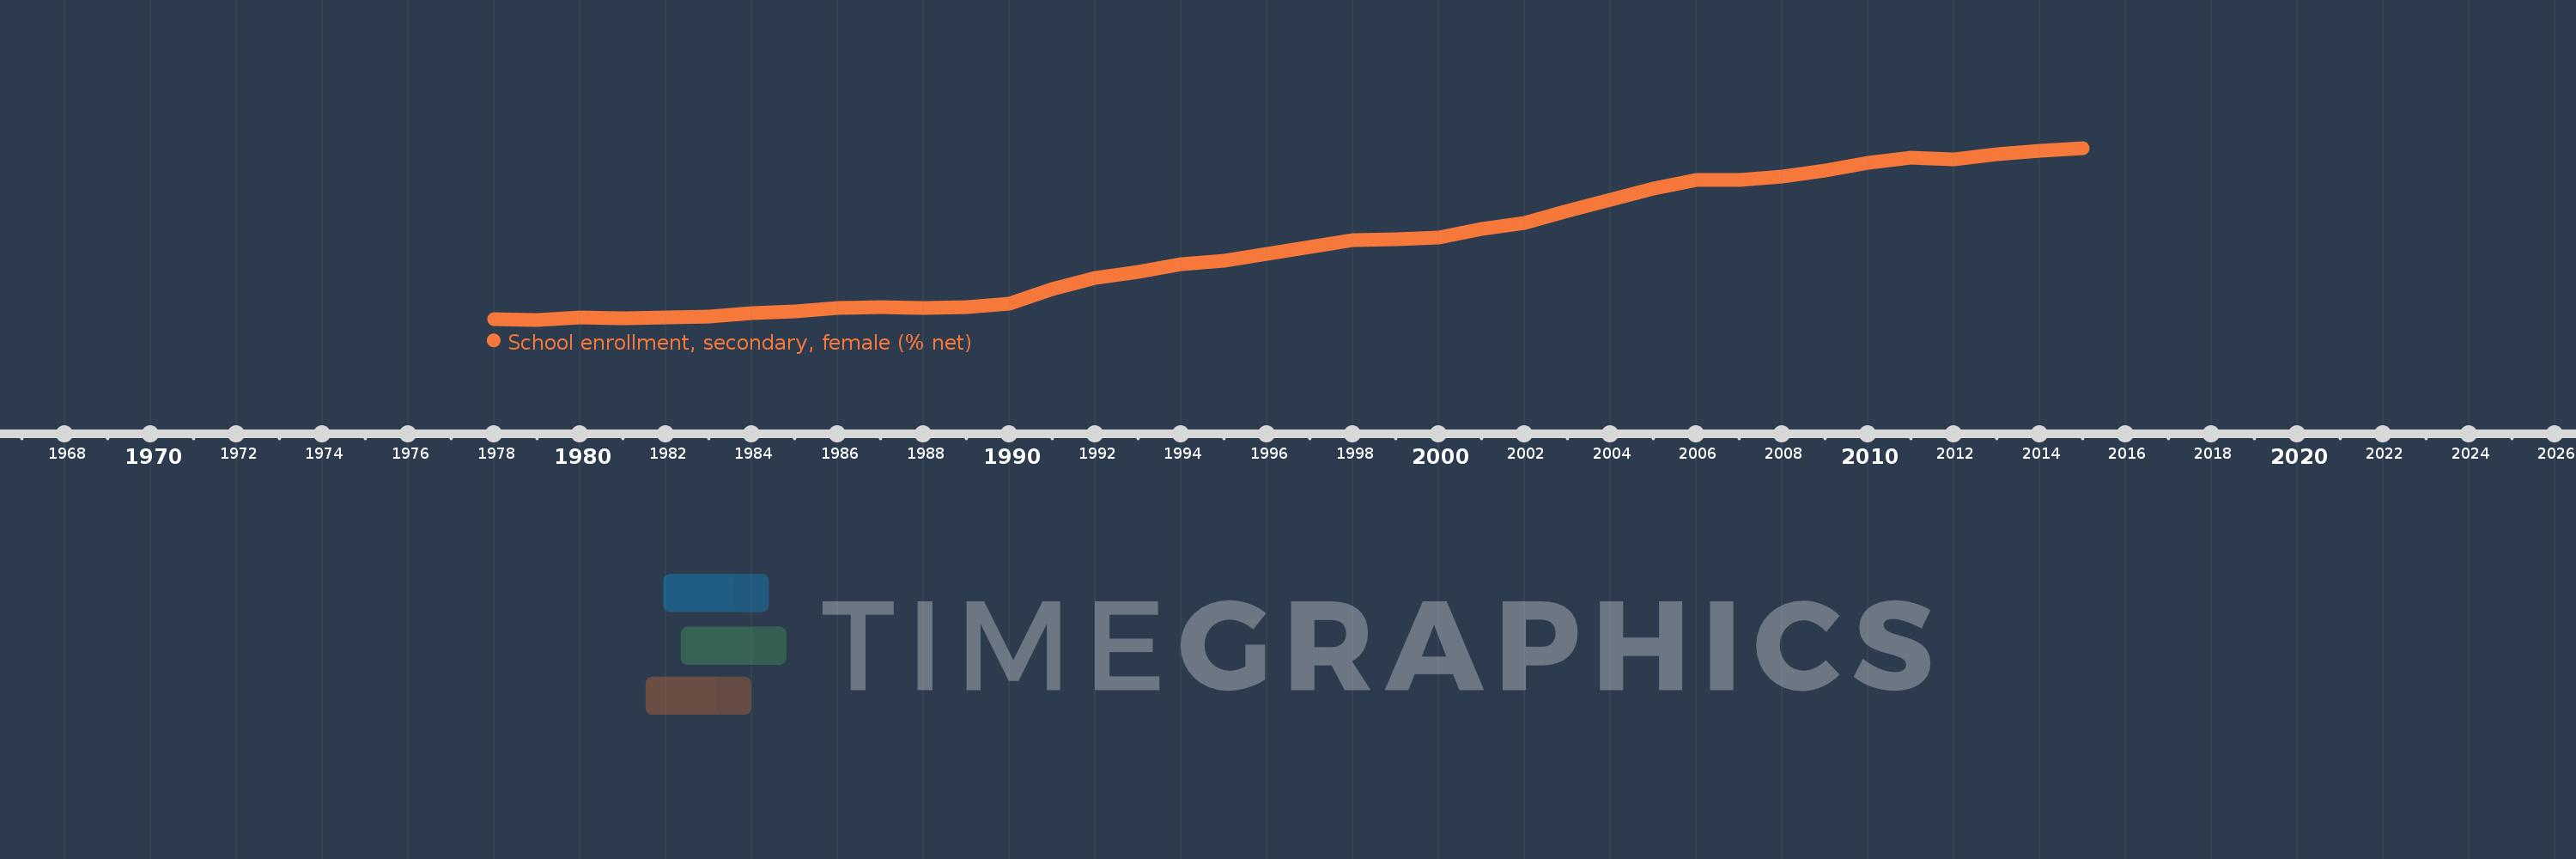
School enrollment, secondary, female (% net)
2015,2014,2013,2012,2011,2010,2009,2008,2007,2006,2005,2003,2002,2001,2000,1999,1998,1997,1996,1995,1994,1993,1992,1991,1990,1989,1988,1987,1986,1985,1984,1983,1982,1981,1980,1979,1978
This statistics in other country:
AfghanistanAlbaniaAlgeriaAngolaAntigua and BarbudaArab WorldArgentinaArmeniaArubaAustraliaAzerbaijanBahamas, TheBahrainBangladeshBarbadosBelarusBelgiumBelizeBeninBermudaBhutanBoliviaBotswanaBrazilBrunei DarussalamBulgariaBurkina FasoBurundiCabo VerdeCambodiaCameroonCanadaCaribbean small statesCentral African RepublicCentral Europe and the BalticsChadChileColombiaComorosCongo, Dem. Rep.Congo, Rep.Costa RicaCroatiaCubaCyprusDenmarkDjiboutiDominicaDominican RepublicEarly-demographic dividendEast Asia & PacificEast Asia & Pacific (excluding high income)East Asia & Pacific (IDA & IBRD countries)EcuadorEgypt, Arab Rep.El SalvadorEquatorial GuineaEritreaEstoniaEthiopiaEuro areaEurope & Central AsiaEurope & Central Asia (excluding high income)Europe & Central Asia (IDA & IBRD countries)European UnionFijiFinlandFragile and conflict affected situationsFranceGambia, TheGeorgiaGhanaGreeceGrenadaGuatemalaGuineaGuinea-BissauGuyanaHeavily indebted poor countries (HIPC)High incomeHondurasHong Kong SAR, ChinaHungaryIBRD onlyIcelandIDA & IBRD totalIDA blendIDA onlyIDA totalIndiaIndonesiaIran, Islamic Rep.IraqIrelandIsraelItalyJamaicaJapanJordanKazakhstanKenyaKiribatiKorea, Rep.KuwaitKyrgyz RepublicLao PDRLate-demographic dividendLatin America & Caribbean Latin America & Caribbean (excluding high income)Latin America & the Caribbean (IDA & IBRD countries)LatviaLeast developed countries: UN classificationLebanonLesothoLibyaLiechtensteinLithuaniaLow & middle incomeLow incomeLower middle incomeLuxembourgMacao SAR, ChinaMacedonia, FYRMadagascarMalawiMaldivesMaliMaltaMarshall IslandsMauritaniaMauritiusMexicoMiddle East & North AfricaMiddle East & North Africa (excluding high income)Middle East & North Africa (IDA & IBRD countries)Middle incomeMoldovaMongoliaMoroccoMozambiqueMyanmarNamibiaNauruNepalNetherlandsNew ZealandNicaraguaNigerNorth AmericaNorwayOECD membersOmanOther small statesPacific island small statesPakistanPanamaParaguayPeruPhilippinesPolandPortugalPost-demographic dividendPre-demographic dividendPuerto RicoQatarRomaniaSamoaSao Tome and PrincipeSaudi ArabiaSenegalSerbiaSeychellesSierra LeoneSloveniaSmall statesSolomon IslandsSomaliaSouth AfricaSouth AsiaSouth Asia (IDA & IBRD)SpainSri LankaSt. Kitts and NevisSt. LuciaSt. Vincent and the GrenadinesSub-Saharan Africa Sub-Saharan Africa (excluding high income)Sub-Saharan Africa (IDA & IBRD countries)SurinameSwazilandSwedenSwitzerlandSyrian Arab RepublicTajikistanThailandTimor-LesteTogoTongaTrinidad and TobagoTunisiaTurkeyTuvaluUgandaUkraineUnited Arab EmiratesUnited KingdomUnited StatesUpper middle incomeUruguayVanuatuVenezuela, RBWest Bank and GazaWorldYemen, Rep.Zimbabwe Timeline:
This timeline shows a graph from 1978 to 2015 of Other small states. No data until 1977. Number of actual observations by date: 37.
Source name:
World Development Indicators
Source organization:
United Nations Educational, Scientific, and Cultural Organization (UNESCO) Institute for Statistics.
Categories, topics:
Education, Gender
Last updated:
apr 23, 2017
Indicators value changes by year
Minimum:
32.698
jan 1, 1979
Maximum:
52.911
jan 1, 2015
At the date of observation
Value
Absolute change
Change from previous value
jan 1, 1978
32.739
+32.739
0.0%
jan 1, 1979
32.698
-0.041
-0.12%
jan 1, 1980
32.934
+0.236
0.72%
jan 1, 1981
32.919
-0.015
-0.05%
jan 1, 1982
32.935
+0.016
0.05%
jan 1, 1983
33.104
+0.169
0.51%
jan 1, 1984
33.464
+0.36
1.09%
jan 1, 1985
33.705
+0.242
0.72%
jan 1, 1986
34.052
+0.347
1.03%
jan 1, 1987
34.215
+0.163
0.48%
jan 1, 1988
34.047
-0.168
-0.49%
jan 1, 1989
34.177
+0.13
0.38%
jan 1, 1990
34.621
+0.444
1.3%
jan 1, 1991
36.26
+1.639
4.73%
jan 1, 1992
37.595
+1.335
3.68%
jan 1, 1993
38.309
+0.714
1.9%
jan 1, 1994
39.26
+0.951
2.48%
jan 1, 1995
39.608
+0.349
0.89%
jan 1, 1996
40.473
+0.865
2.18%
jan 1, 1997
41.227
+0.754
1.86%
jan 1, 1998
42.041
+0.813
1.97%
jan 1, 1999
42.203
+0.163
0.39%
jan 1, 2000
42.399
+0.196
0.46%
jan 1, 2001
43.366
+0.967
2.28%
jan 1, 2002
44.053
+0.687
1.58%
jan 1, 2003
45.518
+1.465
3.33%
jan 1, 2005
48.123
+2.605
5.72%
jan 1, 2006
49.116
+0.992
2.06%
jan 1, 2007
49.175
+0.059
0.12%
jan 1, 2008
49.592
+0.418
0.85%
jan 1, 2009
50.208
+0.616
1.24%
jan 1, 2010
51.196
+0.988
1.97%
jan 1, 2011
51.764
+0.568
1.11%
jan 1, 2012
51.533
-0.231
-0.45%
jan 1, 2013
52.193
+0.66
1.28%
jan 1, 2014
52.588
+0.395
0.76%
jan 1, 2015
52.911
+0.323
0.61%
Ranking of countries by current statistics by years


Comments: