29
/
en
AIzaSyAYiBZKx7MnpbEhh9jyipgxe19OcubqV5w
April 1, 2024
55147
Post-demographic dividend
PST
false
2
1
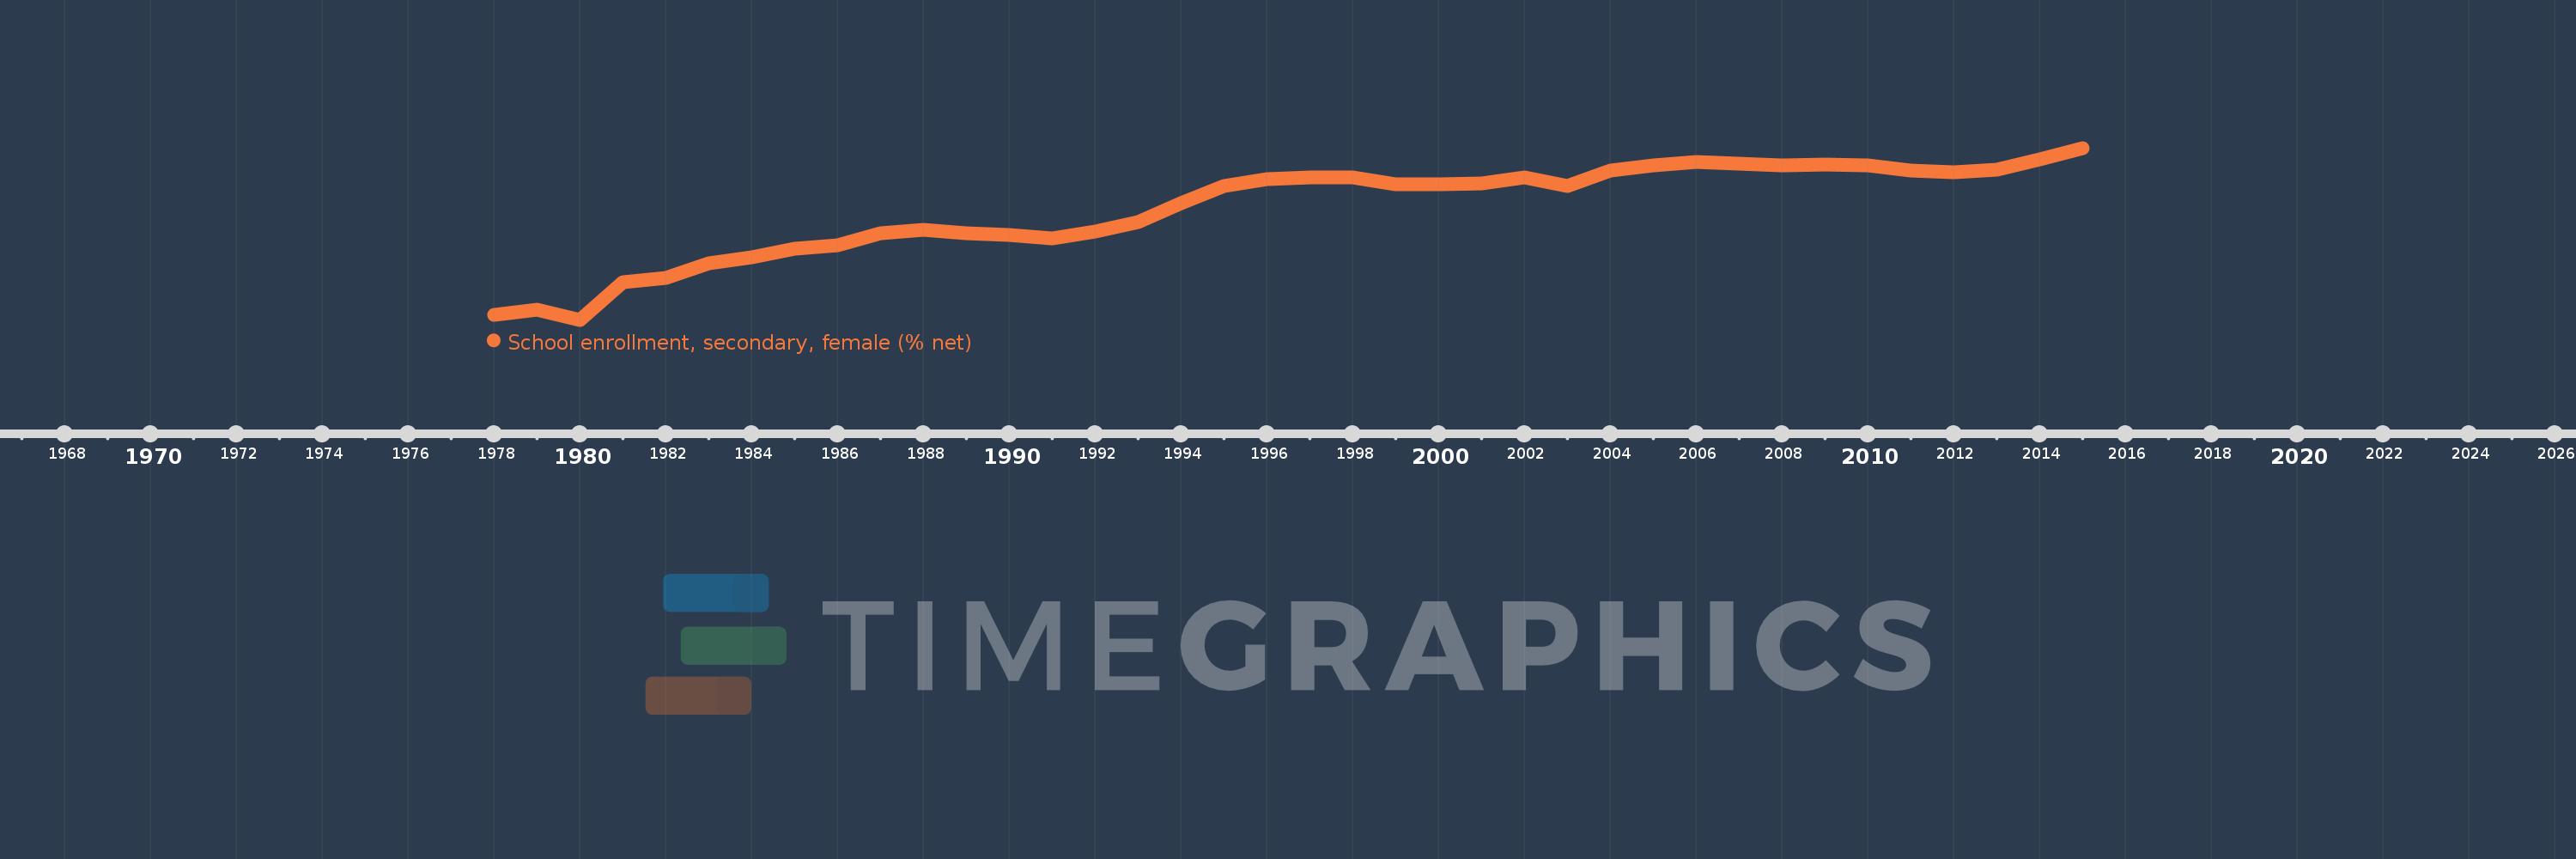
School enrollment, secondary, female (% net)
2015,2014,2013,2012,2011,2010,2009,2008,2007,2006,2005,2004,2003,2002,2001,2000,1999,1998,1997,1996,1995,1994,1993,1992,1991,1990,1989,1988,1987,1986,1985,1984,1983,1982,1981,1980,1979,1978
This statistics in other country:
AfghanistanAlbaniaAlgeriaAngolaAntigua and BarbudaArab WorldArgentinaArmeniaArubaAustraliaAzerbaijanBahamas, TheBahrainBangladeshBarbadosBelarusBelgiumBelizeBeninBermudaBhutanBoliviaBotswanaBrazilBrunei DarussalamBulgariaBurkina FasoBurundiCabo VerdeCambodiaCameroonCanadaCaribbean small statesCentral African RepublicCentral Europe and the BalticsChadChileColombiaComorosCongo, Dem. Rep.Congo, Rep.Costa RicaCroatiaCubaCyprusDenmarkDjiboutiDominicaDominican RepublicEarly-demographic dividendEast Asia & PacificEast Asia & Pacific (excluding high income)East Asia & Pacific (IDA & IBRD countries)EcuadorEgypt, Arab Rep.El SalvadorEquatorial GuineaEritreaEstoniaEthiopiaEuro areaEurope & Central AsiaEurope & Central Asia (excluding high income)Europe & Central Asia (IDA & IBRD countries)European UnionFijiFinlandFragile and conflict affected situationsFranceGambia, TheGeorgiaGhanaGreeceGrenadaGuatemalaGuineaGuinea-BissauGuyanaHeavily indebted poor countries (HIPC)High incomeHondurasHong Kong SAR, ChinaHungaryIBRD onlyIcelandIDA & IBRD totalIDA blendIDA onlyIDA totalIndiaIndonesiaIran, Islamic Rep.IraqIrelandIsraelItalyJamaicaJapanJordanKazakhstanKenyaKiribatiKorea, Rep.KuwaitKyrgyz RepublicLao PDRLate-demographic dividendLatin America & Caribbean Latin America & Caribbean (excluding high income)Latin America & the Caribbean (IDA & IBRD countries)LatviaLeast developed countries: UN classificationLebanonLesothoLibyaLiechtensteinLithuaniaLow & middle incomeLow incomeLower middle incomeLuxembourgMacao SAR, ChinaMacedonia, FYRMadagascarMalawiMaldivesMaliMaltaMarshall IslandsMauritaniaMauritiusMexicoMiddle East & North AfricaMiddle East & North Africa (excluding high income)Middle East & North Africa (IDA & IBRD countries)Middle incomeMoldovaMongoliaMoroccoMozambiqueMyanmarNamibiaNauruNepalNetherlandsNew ZealandNicaraguaNigerNorth AmericaNorwayOECD membersOmanOther small statesPacific island small statesPakistanPanamaParaguayPeruPhilippinesPolandPortugalPost-demographic dividendPre-demographic dividendPuerto RicoQatarRomaniaSamoaSao Tome and PrincipeSaudi ArabiaSenegalSerbiaSeychellesSierra LeoneSloveniaSmall statesSolomon IslandsSomaliaSouth AfricaSouth AsiaSouth Asia (IDA & IBRD)SpainSri LankaSt. Kitts and NevisSt. LuciaSt. Vincent and the GrenadinesSub-Saharan Africa Sub-Saharan Africa (excluding high income)Sub-Saharan Africa (IDA & IBRD countries)SurinameSwazilandSwedenSwitzerlandSyrian Arab RepublicTajikistanThailandTimor-LesteTogoTongaTrinidad and TobagoTunisiaTurkeyTuvaluUgandaUkraineUnited Arab EmiratesUnited KingdomUnited StatesUpper middle incomeUruguayVanuatuVenezuela, RBWest Bank and GazaWorldYemen, Rep.Zimbabwe Timeline:
This timeline shows a graph from 1978 to 2015 of Post-demographic dividend. No data until 1977. Number of actual observations by date: 38.
Source name:
World Development Indicators
Source organization:
United Nations Educational, Scientific, and Cultural Organization (UNESCO) Institute for Statistics.
Categories, topics:
Education, Gender
Last updated:
apr 23, 2017
Indicators value changes by year
Minimum:
77.081
jan 1, 1980
Maximum:
93.236
jan 1, 2015
At the date of observation
Value
Absolute change
Change from previous value
jan 1, 1978
77.538
+77.538
0.0%
jan 1, 1979
78.048
+0.51
0.66%
jan 1, 1980
77.081
-0.967
-1.24%
jan 1, 1981
80.631
+3.551
4.61%
jan 1, 1982
81.022
+0.39
0.48%
jan 1, 1983
82.36
+1.338
1.65%
jan 1, 1984
82.921
+0.561
0.68%
jan 1, 1985
83.77
+0.849
1.02%
jan 1, 1986
84.081
+0.31
0.37%
jan 1, 1987
85.196
+1.115
1.33%
jan 1, 1988
85.57
+0.374
0.44%
jan 1, 1989
85.208
-0.362
-0.42%
jan 1, 1990
85.029
-0.178
-0.21%
jan 1, 1991
84.696
-0.334
-0.39%
jan 1, 1992
85.341
+0.645
0.76%
jan 1, 1993
86.281
+0.94
1.1%
jan 1, 1994
88.054
+1.774
2.06%
jan 1, 1995
89.698
+1.643
1.87%
jan 1, 1996
90.316
+0.619
0.69%
jan 1, 1997
90.472
+0.155
0.17%
jan 1, 1998
90.449
-0.023
-0.03%
jan 1, 1999
89.797
-0.652
-0.72%
jan 1, 2000
89.84
+0.043
0.05%
jan 1, 2001
89.902
+0.062
0.07%
jan 1, 2002
90.478
+0.576
0.64%
jan 1, 2003
89.688
-0.79
-0.87%
jan 1, 2004
91.082
+1.395
1.56%
jan 1, 2005
91.635
+0.552
0.61%
jan 1, 2006
91.9
+0.265
0.29%
jan 1, 2007
91.765
-0.135
-0.15%
jan 1, 2008
91.568
-0.198
-0.22%
jan 1, 2009
91.708
+0.14
0.15%
jan 1, 2010
91.609
-0.099
-0.11%
jan 1, 2011
91.134
-0.476
-0.52%
jan 1, 2012
90.923
-0.21
-0.23%
jan 1, 2013
91.201
+0.278
0.31%
jan 1, 2014
92.159
+0.958
1.05%
jan 1, 2015
93.236
+1.078
1.17%
Ranking of countries by current statistics by years


Comments: