29
/
en
AIzaSyAYiBZKx7MnpbEhh9jyipgxe19OcubqV5w
April 1, 2024
33845
European Union
EUU
false
2
1
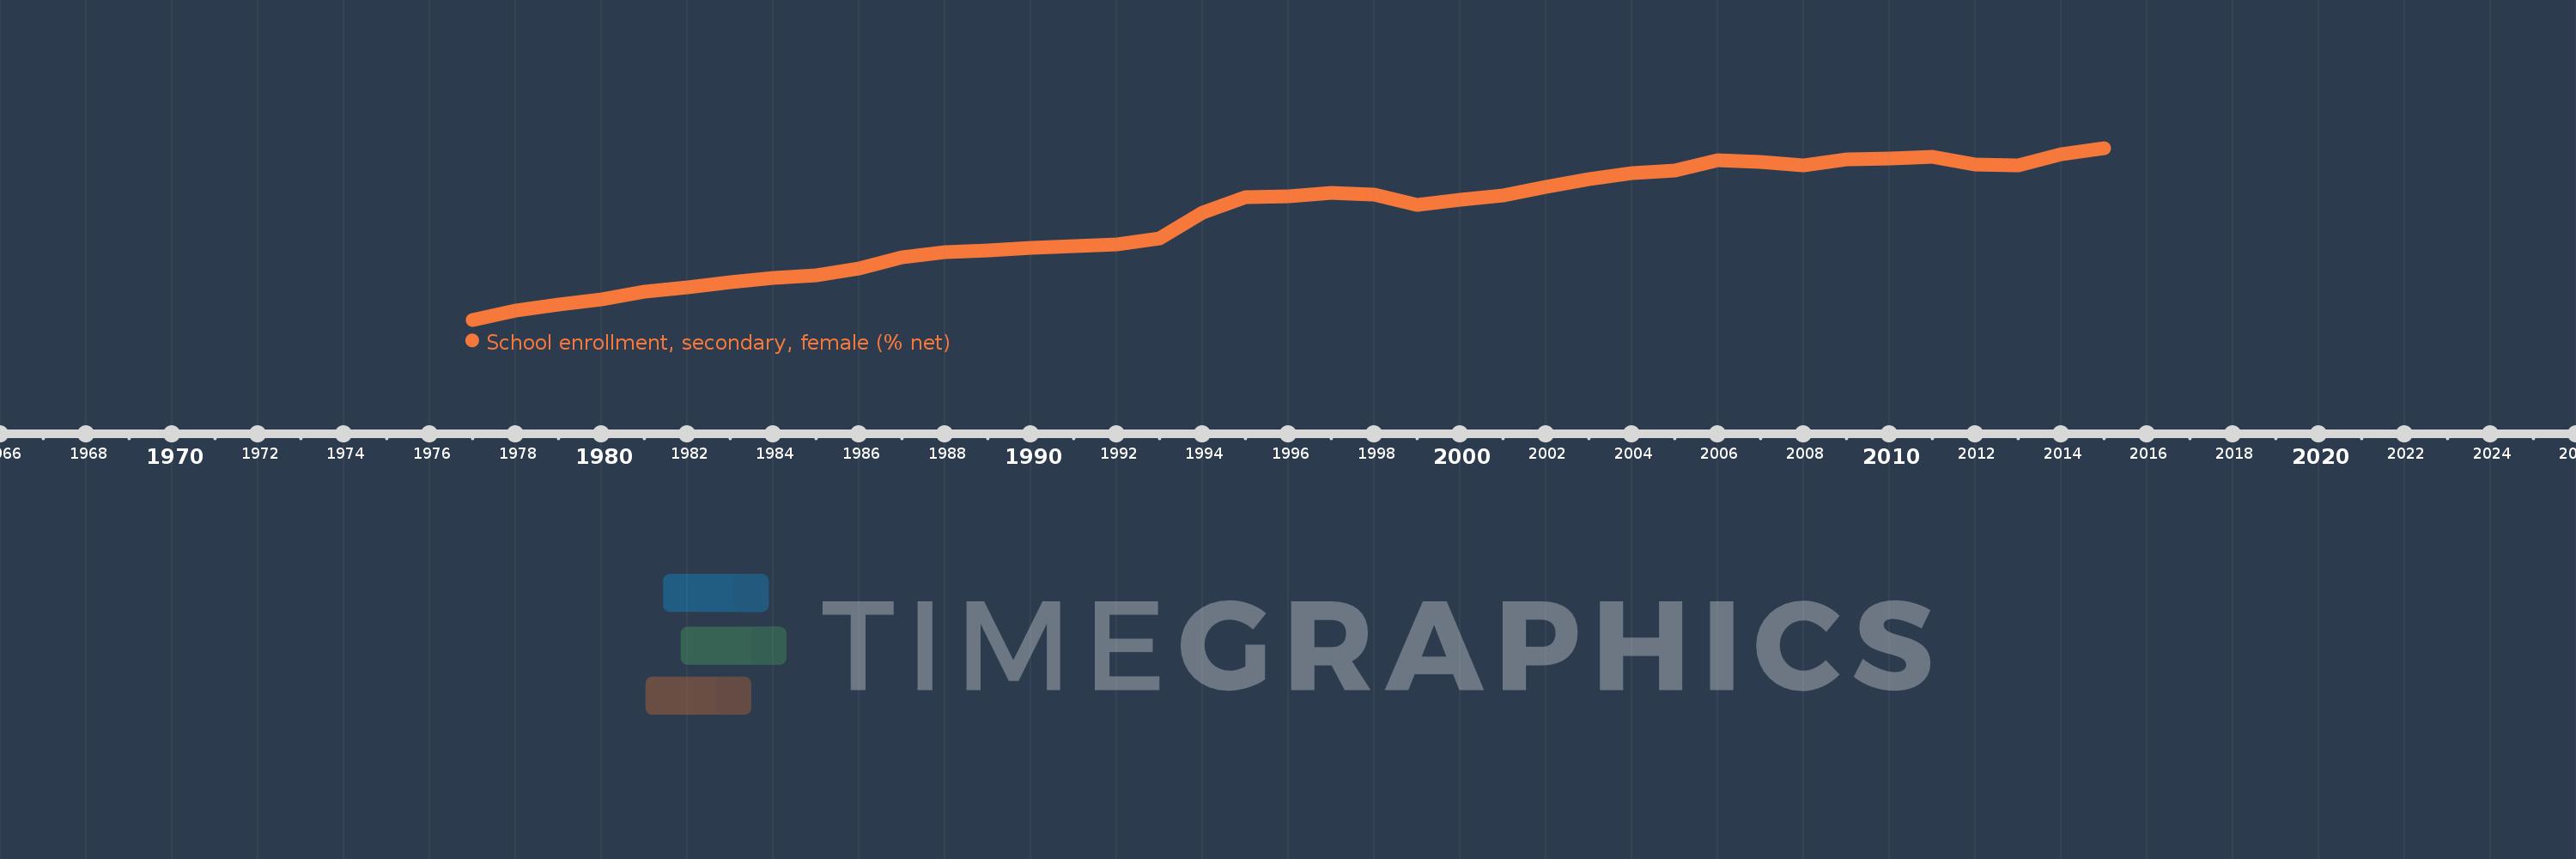
School enrollment, secondary, female (% net)
2015,2014,2013,2012,2011,2010,2009,2008,2007,2006,2005,2004,2003,2002,2001,2000,1999,1998,1997,1996,1995,1994,1993,1992,1991,1990,1989,1988,1987,1986,1985,1984,1983,1982,1981,1980,1979,1978,1977
This statistics in other country:
AfghanistanAlbaniaAlgeriaAngolaAntigua and BarbudaArab WorldArgentinaArmeniaArubaAustraliaAzerbaijanBahamas, TheBahrainBangladeshBarbadosBelarusBelgiumBelizeBeninBermudaBhutanBoliviaBotswanaBrazilBrunei DarussalamBulgariaBurkina FasoBurundiCabo VerdeCambodiaCameroonCanadaCaribbean small statesCentral African RepublicCentral Europe and the BalticsChadChileColombiaComorosCongo, Dem. Rep.Congo, Rep.Costa RicaCroatiaCubaCyprusDenmarkDjiboutiDominicaDominican RepublicEarly-demographic dividendEast Asia & PacificEast Asia & Pacific (excluding high income)East Asia & Pacific (IDA & IBRD countries)EcuadorEgypt, Arab Rep.El SalvadorEquatorial GuineaEritreaEstoniaEthiopiaEuro areaEurope & Central AsiaEurope & Central Asia (excluding high income)Europe & Central Asia (IDA & IBRD countries)European UnionFijiFinlandFragile and conflict affected situationsFranceGambia, TheGeorgiaGhanaGreeceGrenadaGuatemalaGuineaGuinea-BissauGuyanaHeavily indebted poor countries (HIPC)High incomeHondurasHong Kong SAR, ChinaHungaryIBRD onlyIcelandIDA & IBRD totalIDA blendIDA onlyIDA totalIndiaIndonesiaIran, Islamic Rep.IraqIrelandIsraelItalyJamaicaJapanJordanKazakhstanKenyaKiribatiKorea, Rep.KuwaitKyrgyz RepublicLao PDRLate-demographic dividendLatin America & Caribbean Latin America & Caribbean (excluding high income)Latin America & the Caribbean (IDA & IBRD countries)LatviaLeast developed countries: UN classificationLebanonLesothoLibyaLiechtensteinLithuaniaLow & middle incomeLow incomeLower middle incomeLuxembourgMacao SAR, ChinaMacedonia, FYRMadagascarMalawiMaldivesMaliMaltaMarshall IslandsMauritaniaMauritiusMexicoMiddle East & North AfricaMiddle East & North Africa (excluding high income)Middle East & North Africa (IDA & IBRD countries)Middle incomeMoldovaMongoliaMoroccoMozambiqueMyanmarNamibiaNauruNepalNetherlandsNew ZealandNicaraguaNigerNorth AmericaNorwayOECD membersOmanOther small statesPacific island small statesPakistanPanamaParaguayPeruPhilippinesPolandPortugalPost-demographic dividendPre-demographic dividendPuerto RicoQatarRomaniaSamoaSao Tome and PrincipeSaudi ArabiaSenegalSerbiaSeychellesSierra LeoneSloveniaSmall statesSolomon IslandsSomaliaSouth AfricaSouth AsiaSouth Asia (IDA & IBRD)SpainSri LankaSt. Kitts and NevisSt. LuciaSt. Vincent and the GrenadinesSub-Saharan Africa Sub-Saharan Africa (excluding high income)Sub-Saharan Africa (IDA & IBRD countries)SurinameSwazilandSwedenSwitzerlandSyrian Arab RepublicTajikistanThailandTimor-LesteTogoTongaTrinidad and TobagoTunisiaTurkeyTuvaluUgandaUkraineUnited Arab EmiratesUnited KingdomUnited StatesUpper middle incomeUruguayVanuatuVenezuela, RBWest Bank and GazaWorldYemen, Rep.Zimbabwe Timeline:
This timeline shows a graph from 1977 to 2015 of European Union. No data until 1976. Number of actual observations by date: 39.
Source name:
World Development Indicators
Source organization:
United Nations Educational, Scientific, and Cultural Organization (UNESCO) Institute for Statistics.
Categories, topics:
Education, Gender
Last updated:
apr 23, 2017
Indicators value changes by year
Minimum:
74.362
jan 1, 1977
At the date of observation
Value
Absolute change
Change from previous value
jan 1, 1977
74.362
+74.362
0.0%
jan 1, 1978
75.394
+1.031
1.39%
jan 1, 1979
76.055
+0.662
0.88%
jan 1, 1980
76.604
+0.549
0.72%
jan 1, 1981
77.367
+0.763
1.0%
jan 1, 1982
77.908
+0.541
0.7%
jan 1, 1983
78.447
+0.539
0.69%
jan 1, 1984
78.904
+0.457
0.58%
jan 1, 1985
79.181
+0.276
0.35%
jan 1, 1986
79.878
+0.697
0.88%
jan 1, 1987
81.086
+1.208
1.51%
jan 1, 1988
81.639
+0.553
0.68%
jan 1, 1989
81.853
+0.214
0.26%
jan 1, 1990
82.182
+0.329
0.4%
jan 1, 1991
82.346
+0.164
0.2%
jan 1, 1992
82.537
+0.191
0.23%
jan 1, 1993
83.17
+0.633
0.77%
jan 1, 1994
85.979
+2.809
3.38%
jan 1, 1995
87.633
+1.654
1.92%
jan 1, 1996
87.716
+0.083
0.1%
jan 1, 1997
88.144
+0.428
0.49%
jan 1, 1998
87.957
-0.187
-0.21%
jan 1, 1999
86.844
-1.113
-1.27%
jan 1, 2000
87.378
+0.534
0.61%
jan 1, 2001
87.842
+0.464
0.53%
jan 1, 2002
88.74
+0.899
1.02%
jan 1, 2003
89.606
+0.866
0.98%
jan 1, 2004
90.222
+0.615
0.69%
jan 1, 2005
90.567
+0.346
0.38%
jan 1, 2006
91.643
+1.075
1.19%
jan 1, 2007
91.441
-0.202
-0.22%
jan 1, 2008
91.09
-0.351
-0.38%
jan 1, 2009
91.702
+0.611
0.67%
jan 1, 2010
91.802
+0.1
0.11%
jan 1, 2011
92.027
+0.225
0.25%
jan 1, 2012
91.178
-0.849
-0.92%
jan 1, 2013
91.095
-0.083
-0.09%
jan 1, 2014
92.3
+1.204
1.32%
jan 1, 2015
92.97
+0.67
0.73%
Ranking of countries by current statistics by years


Comments: