29
/
en
AIzaSyAYiBZKx7MnpbEhh9jyipgxe19OcubqV5w
April 1, 2024
36166
High income
HIC
false
2
1
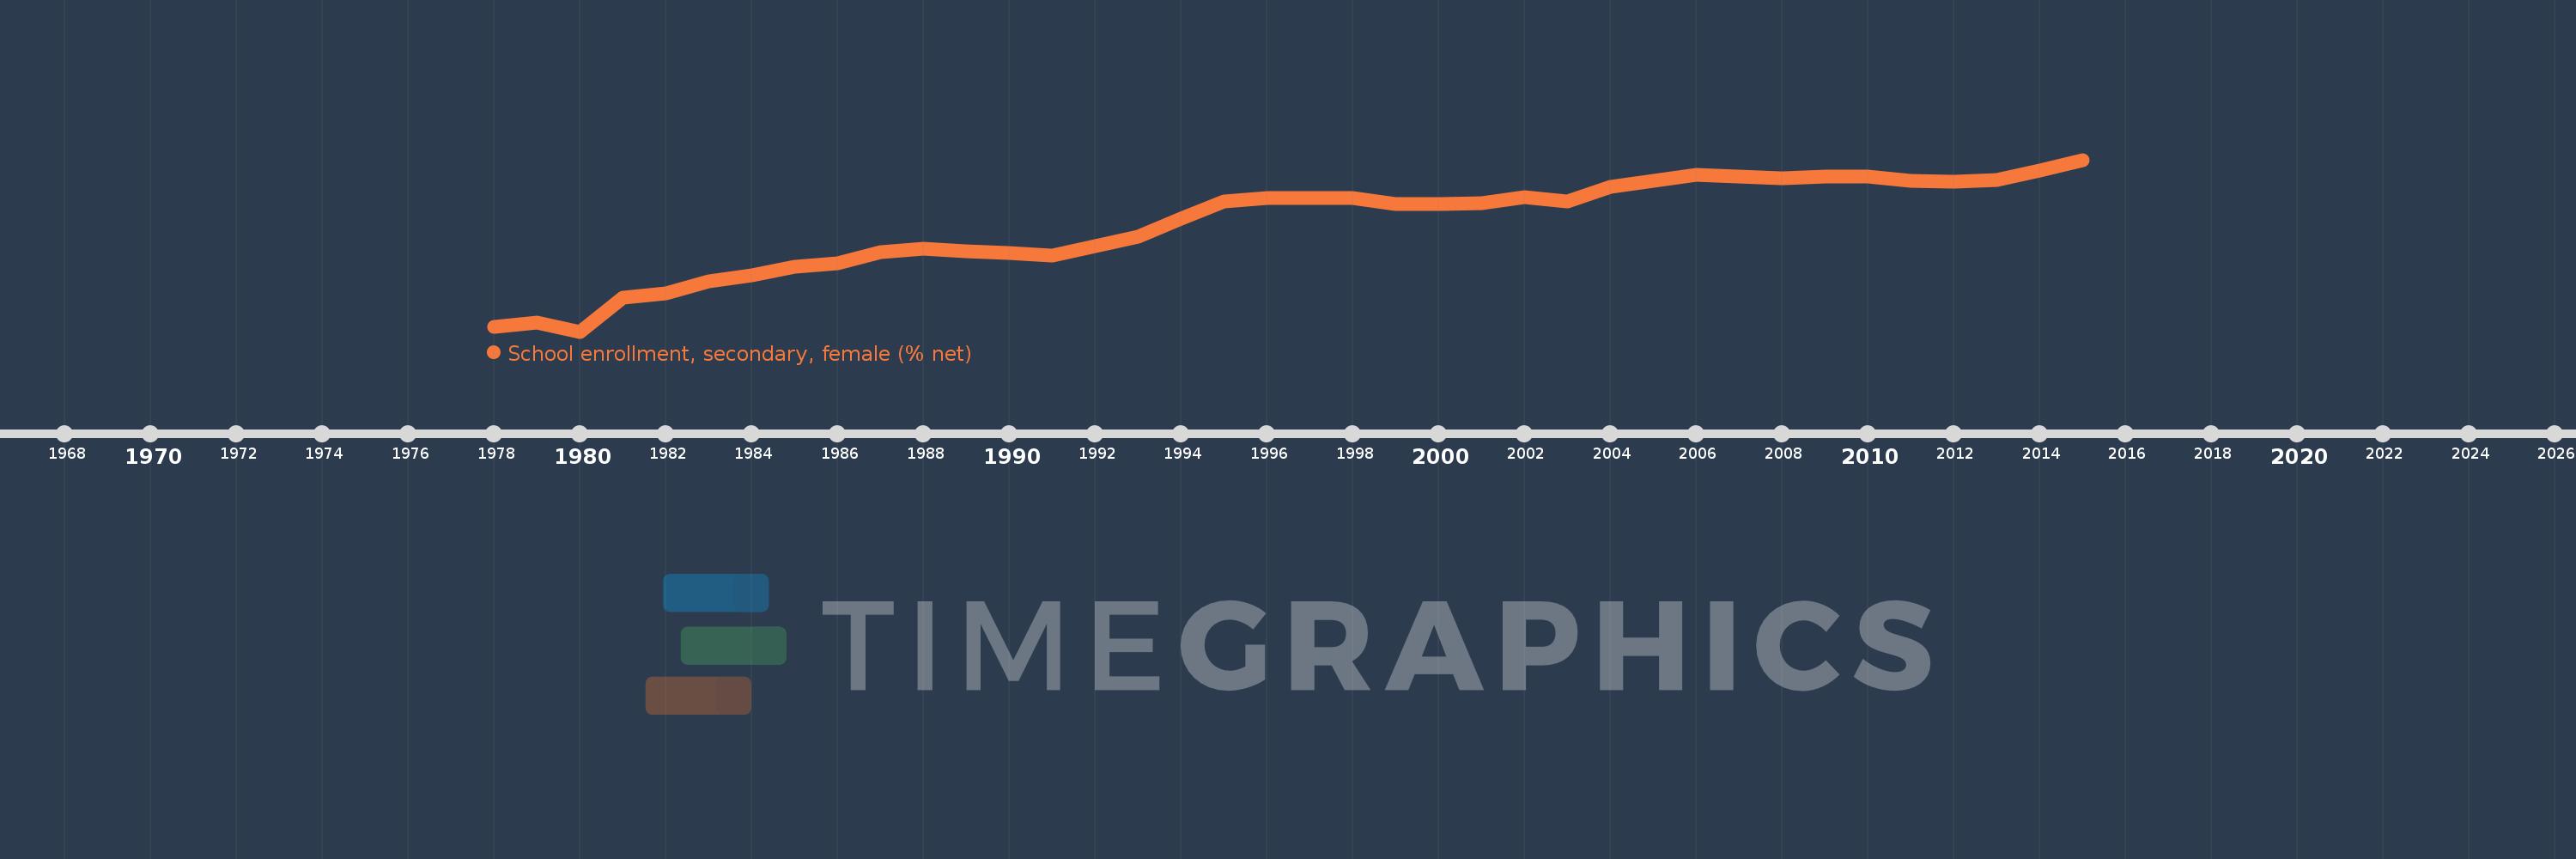
School enrollment, secondary, female (% net)
2015,2014,2013,2012,2011,2010,2009,2008,2007,2006,2005,2004,2003,2002,2001,2000,1999,1998,1997,1996,1995,1994,1993,1992,1991,1990,1989,1988,1987,1986,1985,1984,1983,1982,1981,1980,1979,1978
This statistics in other country:
AfghanistanAlbaniaAlgeriaAngolaAntigua and BarbudaArab WorldArgentinaArmeniaArubaAustraliaAzerbaijanBahamas, TheBahrainBangladeshBarbadosBelarusBelgiumBelizeBeninBermudaBhutanBoliviaBotswanaBrazilBrunei DarussalamBulgariaBurkina FasoBurundiCabo VerdeCambodiaCameroonCanadaCaribbean small statesCentral African RepublicCentral Europe and the BalticsChadChileColombiaComorosCongo, Dem. Rep.Congo, Rep.Costa RicaCroatiaCubaCyprusDenmarkDjiboutiDominicaDominican RepublicEarly-demographic dividendEast Asia & PacificEast Asia & Pacific (excluding high income)East Asia & Pacific (IDA & IBRD countries)EcuadorEgypt, Arab Rep.El SalvadorEquatorial GuineaEritreaEstoniaEthiopiaEuro areaEurope & Central AsiaEurope & Central Asia (excluding high income)Europe & Central Asia (IDA & IBRD countries)European UnionFijiFinlandFragile and conflict affected situationsFranceGambia, TheGeorgiaGhanaGreeceGrenadaGuatemalaGuineaGuinea-BissauGuyanaHeavily indebted poor countries (HIPC)High incomeHondurasHong Kong SAR, ChinaHungaryIBRD onlyIcelandIDA & IBRD totalIDA blendIDA onlyIDA totalIndiaIndonesiaIran, Islamic Rep.IraqIrelandIsraelItalyJamaicaJapanJordanKazakhstanKenyaKiribatiKorea, Rep.KuwaitKyrgyz RepublicLao PDRLate-demographic dividendLatin America & Caribbean Latin America & Caribbean (excluding high income)Latin America & the Caribbean (IDA & IBRD countries)LatviaLeast developed countries: UN classificationLebanonLesothoLibyaLiechtensteinLithuaniaLow & middle incomeLow incomeLower middle incomeLuxembourgMacao SAR, ChinaMacedonia, FYRMadagascarMalawiMaldivesMaliMaltaMarshall IslandsMauritaniaMauritiusMexicoMiddle East & North AfricaMiddle East & North Africa (excluding high income)Middle East & North Africa (IDA & IBRD countries)Middle incomeMoldovaMongoliaMoroccoMozambiqueMyanmarNamibiaNauruNepalNetherlandsNew ZealandNicaraguaNigerNorth AmericaNorwayOECD membersOmanOther small statesPacific island small statesPakistanPanamaParaguayPeruPhilippinesPolandPortugalPost-demographic dividendPre-demographic dividendPuerto RicoQatarRomaniaSamoaSao Tome and PrincipeSaudi ArabiaSenegalSerbiaSeychellesSierra LeoneSloveniaSmall statesSolomon IslandsSomaliaSouth AfricaSouth AsiaSouth Asia (IDA & IBRD)SpainSri LankaSt. Kitts and NevisSt. LuciaSt. Vincent and the GrenadinesSub-Saharan Africa Sub-Saharan Africa (excluding high income)Sub-Saharan Africa (IDA & IBRD countries)SurinameSwazilandSwedenSwitzerlandSyrian Arab RepublicTajikistanThailandTimor-LesteTogoTongaTrinidad and TobagoTunisiaTurkeyTuvaluUgandaUkraineUnited Arab EmiratesUnited KingdomUnited StatesUpper middle incomeUruguayVanuatuVenezuela, RBWest Bank and GazaWorldYemen, Rep.Zimbabwe Timeline:
This timeline shows a graph from 1978 to 2015 of High income. No data until 1977. Number of actual observations by date: 38.
Source name:
World Development Indicators
Source organization:
United Nations Educational, Scientific, and Cultural Organization (UNESCO) Institute for Statistics.
Categories, topics:
Education, Gender
Last updated:
apr 23, 2017
Indicators value changes by year
Maximum:
92.774
jan 1, 2015
At the date of observation
Value
Absolute change
Change from previous value
jan 1, 1978
75.718
+75.718
0.0%
jan 1, 1979
76.235
+0.517
0.68%
jan 1, 1980
75.28
-0.955
-1.25%
jan 1, 1981
78.714
+3.434
4.56%
jan 1, 1982
79.149
+0.435
0.55%
jan 1, 1983
80.42
+1.272
1.61%
jan 1, 1984
80.994
+0.574
0.71%
jan 1, 1985
81.878
+0.883
1.09%
jan 1, 1986
82.271
+0.393
0.48%
jan 1, 1987
83.356
+1.086
1.32%
jan 1, 1988
83.759
+0.403
0.48%
jan 1, 1989
83.437
-0.322
-0.38%
jan 1, 1990
83.243
-0.194
-0.23%
jan 1, 1991
83.018
-0.225
-0.27%
jan 1, 1992
83.948
+0.929
1.12%
jan 1, 1993
84.919
+0.972
1.16%
jan 1, 1994
86.8
+1.881
2.22%
jan 1, 1995
88.542
+1.742
2.01%
jan 1, 1996
88.921
+0.378
0.43%
jan 1, 1997
88.858
-0.063
-0.07%
jan 1, 1998
88.859
+0.001
0.0%
jan 1, 1999
88.247
-0.613
-0.69%
jan 1, 2000
88.3
+0.053
0.06%
jan 1, 2001
88.371
+0.071
0.08%
jan 1, 2002
88.948
+0.577
0.65%
jan 1, 2003
88.56
-0.388
-0.44%
jan 1, 2004
89.977
+1.417
1.6%
jan 1, 2005
90.594
+0.617
0.69%
jan 1, 2006
91.203
+0.609
0.67%
jan 1, 2007
91.051
-0.152
-0.17%
jan 1, 2008
90.871
-0.18
-0.2%
jan 1, 2009
91.071
+0.2
0.22%
jan 1, 2010
91.087
+0.016
0.02%
jan 1, 2011
90.663
-0.424
-0.47%
jan 1, 2012
90.504
-0.159
-0.18%
jan 1, 2013
90.724
+0.22
0.24%
jan 1, 2014
91.644
+0.92
1.01%
jan 1, 2015
92.774
+1.13
1.23%
Ranking of countries by current statistics by years


Comments: