29
/
en
AIzaSyAYiBZKx7MnpbEhh9jyipgxe19OcubqV5w
April 1, 2024
152006
Hong Kong SAR, China
HKG
true
2
1
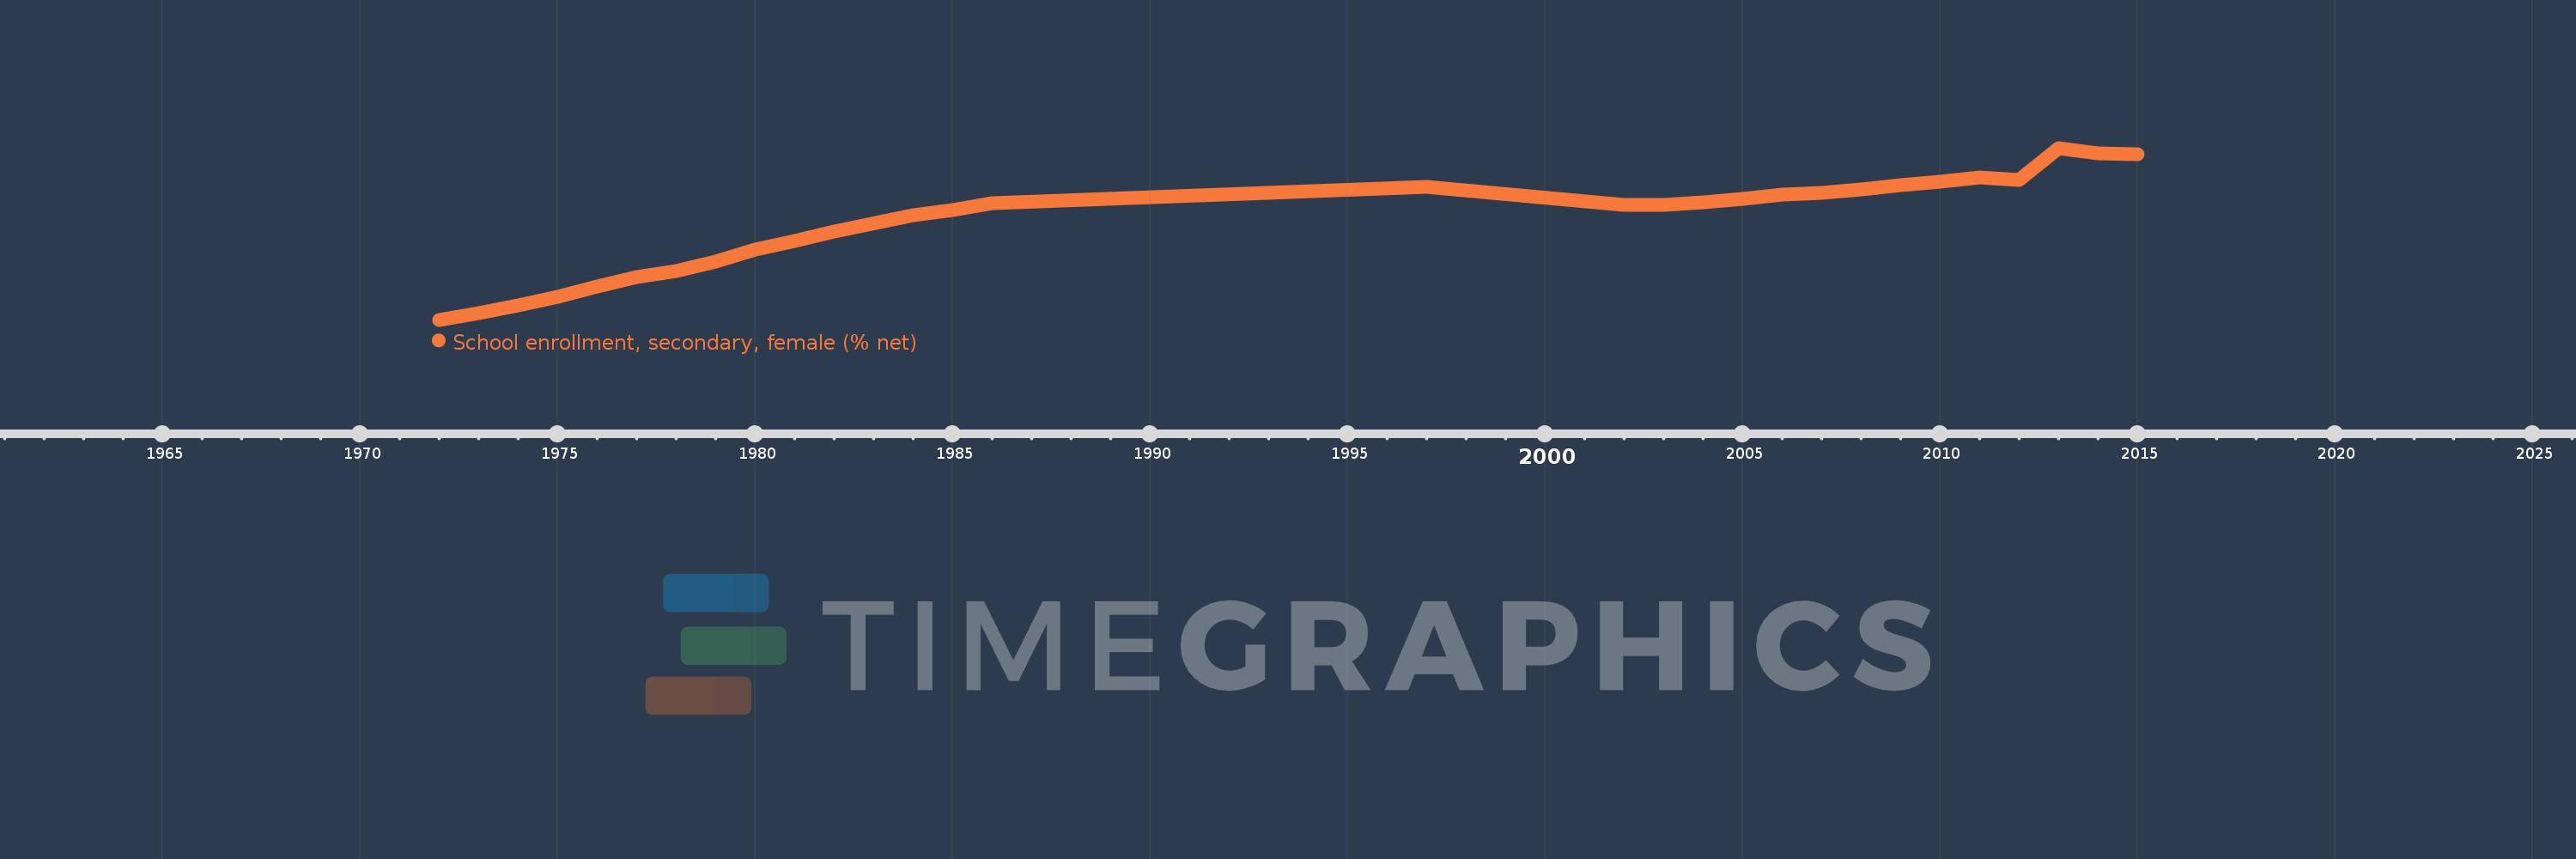
School enrollment, secondary, female (% net)
2015,2014,2013,2012,2011,2010,2009,2008,2007,2006,2005,2004,2003,2002,1997,1986,1985,1984,1982,1981,1980,1979,1978,1977,1976,1975,1974,1973,1972
This statistics in other country:
AfghanistanAlbaniaAlgeriaAngolaAntigua and BarbudaArab WorldArgentinaArmeniaArubaAustraliaAzerbaijanBahamas, TheBahrainBangladeshBarbadosBelarusBelgiumBelizeBeninBermudaBhutanBoliviaBotswanaBrazilBrunei DarussalamBulgariaBurkina FasoBurundiCabo VerdeCambodiaCameroonCanadaCaribbean small statesCentral African RepublicCentral Europe and the BalticsChadChileColombiaComorosCongo, Dem. Rep.Congo, Rep.Costa RicaCroatiaCubaCyprusDenmarkDjiboutiDominicaDominican RepublicEarly-demographic dividendEast Asia & PacificEast Asia & Pacific (excluding high income)East Asia & Pacific (IDA & IBRD countries)EcuadorEgypt, Arab Rep.El SalvadorEquatorial GuineaEritreaEstoniaEthiopiaEuro areaEurope & Central AsiaEurope & Central Asia (excluding high income)Europe & Central Asia (IDA & IBRD countries)European UnionFijiFinlandFragile and conflict affected situationsFranceGambia, TheGeorgiaGhanaGreeceGrenadaGuatemalaGuineaGuinea-BissauGuyanaHeavily indebted poor countries (HIPC)High incomeHondurasHong Kong SAR, ChinaHungaryIBRD onlyIcelandIDA & IBRD totalIDA blendIDA onlyIDA totalIndiaIndonesiaIran, Islamic Rep.IraqIrelandIsraelItalyJamaicaJapanJordanKazakhstanKenyaKiribatiKorea, Rep.KuwaitKyrgyz RepublicLao PDRLate-demographic dividendLatin America & Caribbean Latin America & Caribbean (excluding high income)Latin America & the Caribbean (IDA & IBRD countries)LatviaLeast developed countries: UN classificationLebanonLesothoLibyaLiechtensteinLithuaniaLow & middle incomeLow incomeLower middle incomeLuxembourgMacao SAR, ChinaMacedonia, FYRMadagascarMalawiMaldivesMaliMaltaMarshall IslandsMauritaniaMauritiusMexicoMiddle East & North AfricaMiddle East & North Africa (excluding high income)Middle East & North Africa (IDA & IBRD countries)Middle incomeMoldovaMongoliaMoroccoMozambiqueMyanmarNamibiaNauruNepalNetherlandsNew ZealandNicaraguaNigerNorth AmericaNorwayOECD membersOmanOther small statesPacific island small statesPakistanPanamaParaguayPeruPhilippinesPolandPortugalPost-demographic dividendPre-demographic dividendPuerto RicoQatarRomaniaSamoaSao Tome and PrincipeSaudi ArabiaSenegalSerbiaSeychellesSierra LeoneSloveniaSmall statesSolomon IslandsSomaliaSouth AfricaSouth AsiaSouth Asia (IDA & IBRD)SpainSri LankaSt. Kitts and NevisSt. LuciaSt. Vincent and the GrenadinesSub-Saharan Africa Sub-Saharan Africa (excluding high income)Sub-Saharan Africa (IDA & IBRD countries)SurinameSwazilandSwedenSwitzerlandSyrian Arab RepublicTajikistanThailandTimor-LesteTogoTongaTrinidad and TobagoTunisiaTurkeyTuvaluUgandaUkraineUnited Arab EmiratesUnited KingdomUnited StatesUpper middle incomeUruguayVanuatuVenezuela, RBWest Bank and GazaWorldYemen, Rep.Zimbabwe Timeline:
This timeline shows a graph from 1972 to 2015 of Hong Kong SAR, China. No data until 1971. Number of actual observations by date: 29.
Source name:
World Development Indicators
Source organization:
United Nations Educational, Scientific, and Cultural Organization (UNESCO) Institute for Statistics.
Categories, topics:
Education, Gender
Last updated:
apr 23, 2017
Indicators value changes by year
Minimum:
29.074
jan 1, 1972
Maximum:
90.091
jan 1, 2013
At the date of observation
Value
Absolute change
Change from previous value
jan 1, 1972
29.074
+29.074
0.0%
jan 1, 1973
31.282
+2.208
7.6%
jan 1, 1974
34.084
+2.802
8.96%
jan 1, 1975
37.23
+3.145
9.23%
jan 1, 1976
40.88
+3.651
9.81%
jan 1, 1977
44.196
+3.316
8.11%
jan 1, 1978
46.508
+2.312
5.23%
jan 1, 1979
49.589
+3.081
6.62%
jan 1, 1980
54.0
+4.41
8.89%
jan 1, 1981
57.071
+3.072
5.69%
jan 1, 1982
60.388
+3.316
5.81%
jan 1, 1984
66.229
+5.841
9.67%
jan 1, 1985
68.032
+1.803
2.72%
jan 1, 1986
70.372
+2.34
3.44%
jan 1, 1997
76.166
+5.793
8.23%
jan 1, 2002
69.929
-6.237
-8.19%
jan 1, 2003
69.753
-0.176
-0.25%
jan 1, 2004
70.827
+1.075
1.54%
jan 1, 2005
72.148
+1.32
1.86%
jan 1, 2006
73.543
+1.396
1.93%
jan 1, 2007
74.081
+0.538
0.73%
jan 1, 2008
75.315
+1.234
1.67%
jan 1, 2009
76.792
+1.477
1.96%
jan 1, 2010
78.246
+1.454
1.89%
jan 1, 2011
79.649
+1.403
1.79%
jan 1, 2012
78.794
-0.855
-1.07%
jan 1, 2013
90.091
+11.297
14.34%
jan 1, 2014
88.165
-1.926
-2.14%
jan 1, 2015
87.828
-0.336
-0.38%
Ranking of countries by current statistics by years


Comments: