29
/
en
AIzaSyAYiBZKx7MnpbEhh9jyipgxe19OcubqV5w
April 1, 2024
182537
Luxembourg
LUX
true
2
1
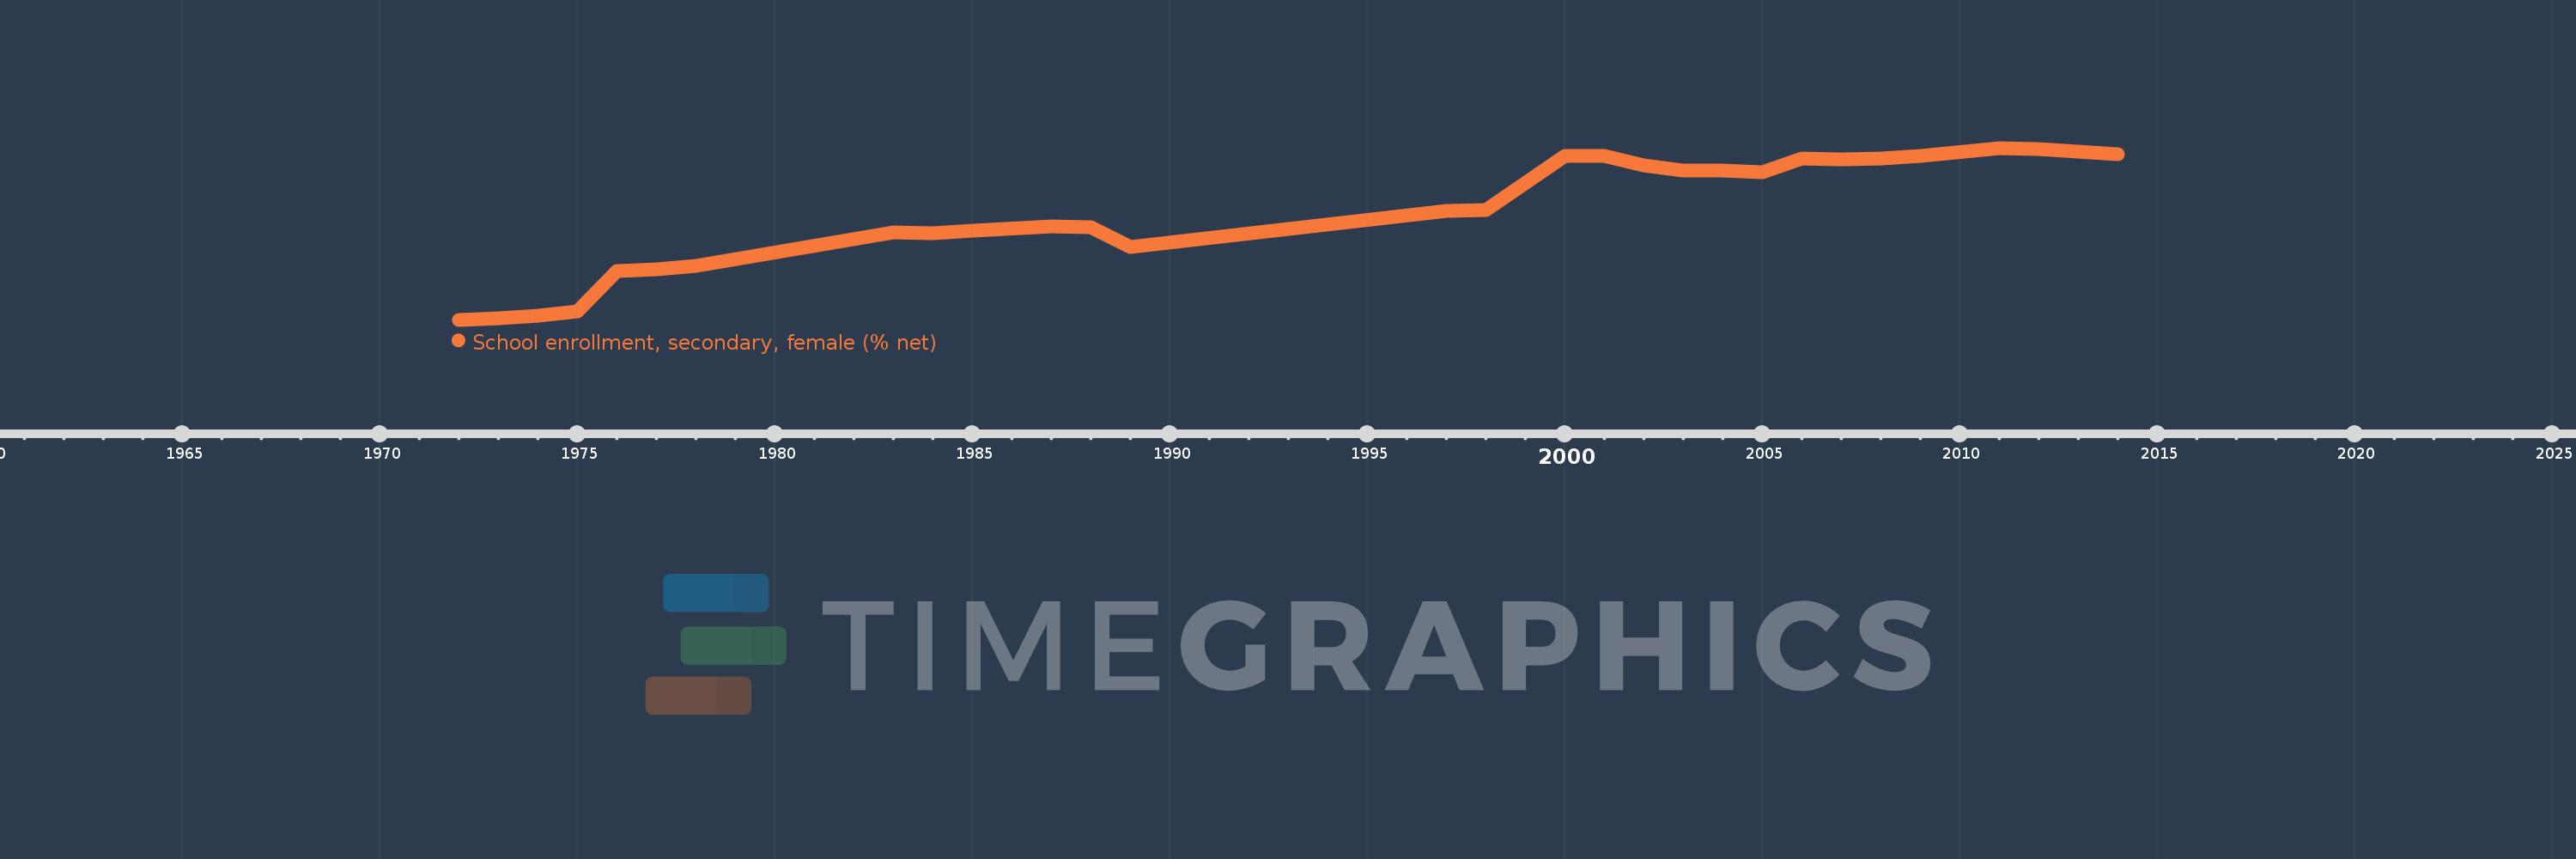
School enrollment, secondary, female (% net)
2014,2013,2012,2011,2009,2008,2007,2006,2005,2004,2003,2002,2001,2000,1998,1997,1989,1988,1987,1985,1984,1983,1978,1977,1976,1975,1974,1973,1972
This statistics in other country:
AfghanistanAlbaniaAlgeriaAngolaAntigua and BarbudaArab WorldArgentinaArmeniaArubaAustraliaAzerbaijanBahamas, TheBahrainBangladeshBarbadosBelarusBelgiumBelizeBeninBermudaBhutanBoliviaBotswanaBrazilBrunei DarussalamBulgariaBurkina FasoBurundiCabo VerdeCambodiaCameroonCanadaCaribbean small statesCentral African RepublicCentral Europe and the BalticsChadChileColombiaComorosCongo, Dem. Rep.Congo, Rep.Costa RicaCroatiaCubaCyprusDenmarkDjiboutiDominicaDominican RepublicEarly-demographic dividendEast Asia & PacificEast Asia & Pacific (excluding high income)East Asia & Pacific (IDA & IBRD countries)EcuadorEgypt, Arab Rep.El SalvadorEquatorial GuineaEritreaEstoniaEthiopiaEuro areaEurope & Central AsiaEurope & Central Asia (excluding high income)Europe & Central Asia (IDA & IBRD countries)European UnionFijiFinlandFragile and conflict affected situationsFranceGambia, TheGeorgiaGhanaGreeceGrenadaGuatemalaGuineaGuinea-BissauGuyanaHeavily indebted poor countries (HIPC)High incomeHondurasHong Kong SAR, ChinaHungaryIBRD onlyIcelandIDA & IBRD totalIDA blendIDA onlyIDA totalIndiaIndonesiaIran, Islamic Rep.IraqIrelandIsraelItalyJamaicaJapanJordanKazakhstanKenyaKiribatiKorea, Rep.KuwaitKyrgyz RepublicLao PDRLate-demographic dividendLatin America & Caribbean Latin America & Caribbean (excluding high income)Latin America & the Caribbean (IDA & IBRD countries)LatviaLeast developed countries: UN classificationLebanonLesothoLibyaLiechtensteinLithuaniaLow & middle incomeLow incomeLower middle incomeLuxembourgMacao SAR, ChinaMacedonia, FYRMadagascarMalawiMaldivesMaliMaltaMarshall IslandsMauritaniaMauritiusMexicoMiddle East & North AfricaMiddle East & North Africa (excluding high income)Middle East & North Africa (IDA & IBRD countries)Middle incomeMoldovaMongoliaMoroccoMozambiqueMyanmarNamibiaNauruNepalNetherlandsNew ZealandNicaraguaNigerNorth AmericaNorwayOECD membersOmanOther small statesPacific island small statesPakistanPanamaParaguayPeruPhilippinesPolandPortugalPost-demographic dividendPre-demographic dividendPuerto RicoQatarRomaniaSamoaSao Tome and PrincipeSaudi ArabiaSenegalSerbiaSeychellesSierra LeoneSloveniaSmall statesSolomon IslandsSomaliaSouth AfricaSouth AsiaSouth Asia (IDA & IBRD)SpainSri LankaSt. Kitts and NevisSt. LuciaSt. Vincent and the GrenadinesSub-Saharan Africa Sub-Saharan Africa (excluding high income)Sub-Saharan Africa (IDA & IBRD countries)SurinameSwazilandSwedenSwitzerlandSyrian Arab RepublicTajikistanThailandTimor-LesteTogoTongaTrinidad and TobagoTunisiaTurkeyTuvaluUgandaUkraineUnited Arab EmiratesUnited KingdomUnited StatesUpper middle incomeUruguayVanuatuVenezuela, RBWest Bank and GazaWorldYemen, Rep.Zimbabwe Timeline:
This timeline shows a graph from 1972 to 2014 of Luxembourg. No data until 1971. Number of actual observations by date: 29.
Source name:
World Development Indicators
Source organization:
United Nations Educational, Scientific, and Cultural Organization (UNESCO) Institute for Statistics.
Categories, topics:
Education, Gender
Last updated:
apr 23, 2017
Indicators value changes by year
Minimum:
43.717
jan 1, 1972
Maximum:
88.499
jan 1, 2011
At the date of observation
Value
Absolute change
Change from previous value
jan 1, 1972
43.717
+43.717
0.0%
jan 1, 1973
44.016
+0.299
0.68%
jan 1, 1974
44.826
+0.81
1.84%
jan 1, 1975
45.999
+1.173
2.62%
jan 1, 1976
56.402
+10.404
22.62%
jan 1, 1977
56.764
+0.361
0.64%
jan 1, 1978
57.775
+1.012
1.78%
jan 1, 1983
66.54
+8.765
15.17%
jan 1, 1984
66.292
-0.248
-0.37%
jan 1, 1985
67.011
+0.72
1.09%
jan 1, 1987
68.018
+1.007
1.5%
jan 1, 1988
67.932
-0.086
-0.13%
jan 1, 1989
62.717
-5.216
-7.68%
jan 1, 1997
72.189
+9.472
15.1%
jan 1, 1998
72.21
+0.021
0.03%
jan 1, 2000
86.325
+14.114
19.55%
jan 1, 2001
86.465
+0.14
0.16%
jan 1, 2002
83.959
-2.506
-2.9%
jan 1, 2003
82.696
-1.263
-1.5%
jan 1, 2004
82.607
-0.089
-0.11%
jan 1, 2005
82.138
-0.469
-0.57%
jan 1, 2006
85.636
+3.498
4.26%
jan 1, 2007
85.589
-0.046
-0.05%
jan 1, 2008
85.781
+0.192
0.22%
jan 1, 2009
86.373
+0.592
0.69%
jan 1, 2011
88.499
+2.126
2.46%
jan 1, 2012
88.29
-0.209
-0.24%
jan 1, 2013
87.518
-0.772
-0.87%
jan 1, 2014
86.926
-0.592
-0.68%
Ranking of countries by current statistics by years


Comments: