29
/
en
AIzaSyAYiBZKx7MnpbEhh9jyipgxe19OcubqV5w
April 1, 2024
44649
Least developed countries: UN classification
LDC
false
2
1
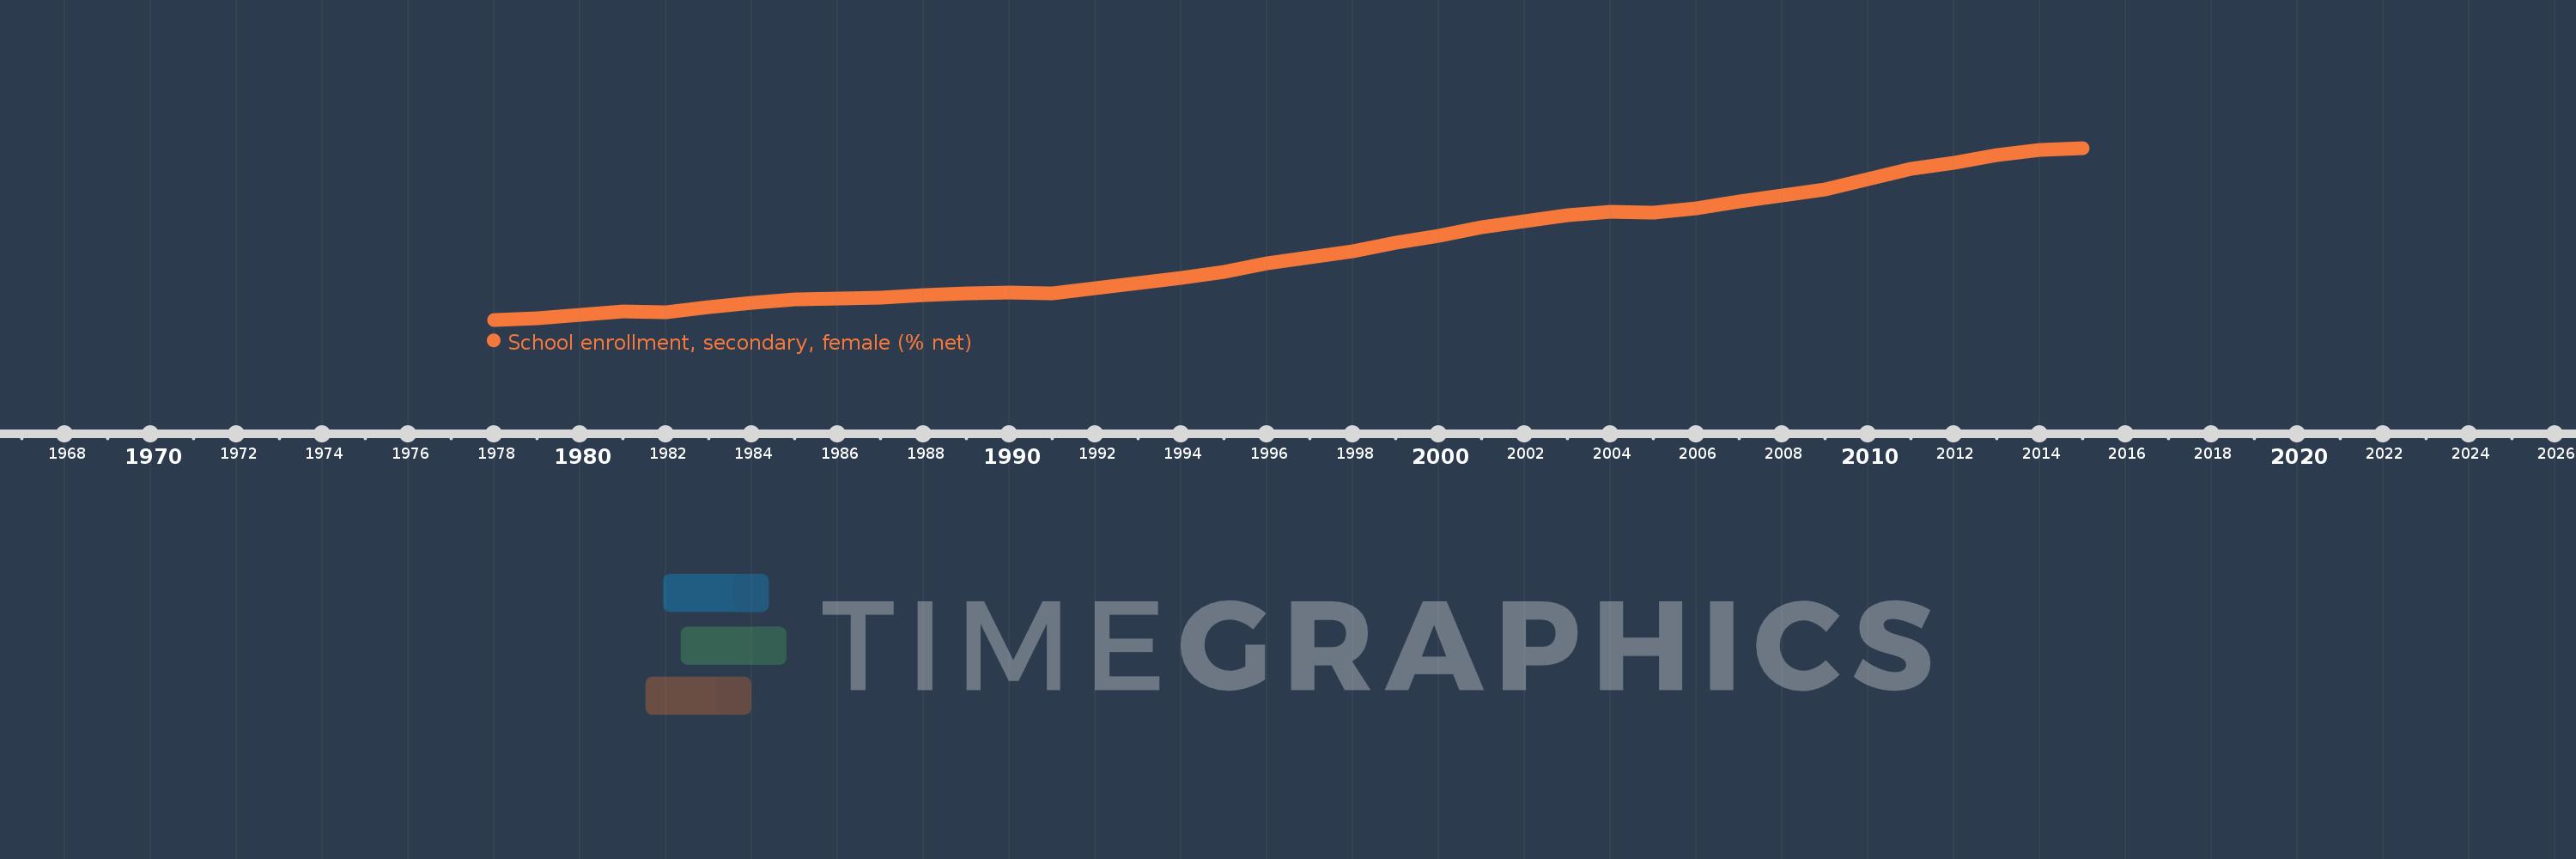
School enrollment, secondary, female (% net)
2015,2014,2013,2012,2011,2010,2009,2008,2007,2006,2005,2004,2003,2002,2001,2000,1999,1998,1997,1996,1995,1994,1993,1992,1991,1990,1989,1988,1987,1986,1985,1984,1983,1982,1981,1980,1979,1978
This statistics in other country:
AfghanistanAlbaniaAlgeriaAngolaAntigua and BarbudaArab WorldArgentinaArmeniaArubaAustraliaAzerbaijanBahamas, TheBahrainBangladeshBarbadosBelarusBelgiumBelizeBeninBermudaBhutanBoliviaBotswanaBrazilBrunei DarussalamBulgariaBurkina FasoBurundiCabo VerdeCambodiaCameroonCanadaCaribbean small statesCentral African RepublicCentral Europe and the BalticsChadChileColombiaComorosCongo, Dem. Rep.Congo, Rep.Costa RicaCroatiaCubaCyprusDenmarkDjiboutiDominicaDominican RepublicEarly-demographic dividendEast Asia & PacificEast Asia & Pacific (excluding high income)East Asia & Pacific (IDA & IBRD countries)EcuadorEgypt, Arab Rep.El SalvadorEquatorial GuineaEritreaEstoniaEthiopiaEuro areaEurope & Central AsiaEurope & Central Asia (excluding high income)Europe & Central Asia (IDA & IBRD countries)European UnionFijiFinlandFragile and conflict affected situationsFranceGambia, TheGeorgiaGhanaGreeceGrenadaGuatemalaGuineaGuinea-BissauGuyanaHeavily indebted poor countries (HIPC)High incomeHondurasHong Kong SAR, ChinaHungaryIBRD onlyIcelandIDA & IBRD totalIDA blendIDA onlyIDA totalIndiaIndonesiaIran, Islamic Rep.IraqIrelandIsraelItalyJamaicaJapanJordanKazakhstanKenyaKiribatiKorea, Rep.KuwaitKyrgyz RepublicLao PDRLate-demographic dividendLatin America & Caribbean Latin America & Caribbean (excluding high income)Latin America & the Caribbean (IDA & IBRD countries)LatviaLeast developed countries: UN classificationLebanonLesothoLibyaLiechtensteinLithuaniaLow & middle incomeLow incomeLower middle incomeLuxembourgMacao SAR, ChinaMacedonia, FYRMadagascarMalawiMaldivesMaliMaltaMarshall IslandsMauritaniaMauritiusMexicoMiddle East & North AfricaMiddle East & North Africa (excluding high income)Middle East & North Africa (IDA & IBRD countries)Middle incomeMoldovaMongoliaMoroccoMozambiqueMyanmarNamibiaNauruNepalNetherlandsNew ZealandNicaraguaNigerNorth AmericaNorwayOECD membersOmanOther small statesPacific island small statesPakistanPanamaParaguayPeruPhilippinesPolandPortugalPost-demographic dividendPre-demographic dividendPuerto RicoQatarRomaniaSamoaSao Tome and PrincipeSaudi ArabiaSenegalSerbiaSeychellesSierra LeoneSloveniaSmall statesSolomon IslandsSomaliaSouth AfricaSouth AsiaSouth Asia (IDA & IBRD)SpainSri LankaSt. Kitts and NevisSt. LuciaSt. Vincent and the GrenadinesSub-Saharan Africa Sub-Saharan Africa (excluding high income)Sub-Saharan Africa (IDA & IBRD countries)SurinameSwazilandSwedenSwitzerlandSyrian Arab RepublicTajikistanThailandTimor-LesteTogoTongaTrinidad and TobagoTunisiaTurkeyTuvaluUgandaUkraineUnited Arab EmiratesUnited KingdomUnited StatesUpper middle incomeUruguayVanuatuVenezuela, RBWest Bank and GazaWorldYemen, Rep.Zimbabwe Timeline:
This timeline shows a graph from 1978 to 2015 of Least developed countries: UN classification. No data until 1977. Number of actual observations by date: 38.
Source name:
World Development Indicators
Source organization:
United Nations Educational, Scientific, and Cultural Organization (UNESCO) Institute for Statistics.
Categories, topics:
Education, Gender
Last updated:
apr 23, 2017
Indicators value changes by year
Maximum:
33.274
jan 1, 2015
At the date of observation
Value
Absolute change
Change from previous value
jan 1, 1978
8.322
+8.322
0.0%
jan 1, 1979
8.596
+0.274
3.3%
jan 1, 1980
9.032
+0.436
5.07%
jan 1, 1981
9.547
+0.515
5.7%
jan 1, 1982
9.436
-0.112
-1.17%
jan 1, 1983
10.193
+0.758
8.03%
jan 1, 1984
10.821
+0.628
6.16%
jan 1, 1985
11.255
+0.434
4.01%
jan 1, 1986
11.375
+0.12
1.07%
jan 1, 1987
11.536
+0.161
1.41%
jan 1, 1988
11.845
+0.309
2.68%
jan 1, 1989
12.1
+0.255
2.15%
jan 1, 1990
12.298
+0.198
1.64%
jan 1, 1991
12.094
-0.204
-1.66%
jan 1, 1992
12.918
+0.823
6.81%
jan 1, 1993
13.681
+0.764
5.91%
jan 1, 1994
14.381
+0.699
5.11%
jan 1, 1995
15.233
+0.853
5.93%
jan 1, 1996
16.457
+1.223
8.03%
jan 1, 1997
17.409
+0.952
5.79%
jan 1, 1998
18.291
+0.882
5.07%
jan 1, 1999
19.525
+1.234
6.75%
jan 1, 2000
20.557
+1.032
5.29%
jan 1, 2001
21.744
+1.187
5.77%
jan 1, 2002
22.621
+0.878
4.04%
jan 1, 2003
23.512
+0.891
3.94%
jan 1, 2004
23.986
+0.474
2.02%
jan 1, 2005
23.829
-0.157
-0.65%
jan 1, 2006
24.517
+0.688
2.89%
jan 1, 2007
25.489
+0.972
3.96%
jan 1, 2008
26.43
+0.941
3.69%
jan 1, 2009
27.285
+0.854
3.23%
jan 1, 2010
28.779
+1.494
5.48%
jan 1, 2011
30.24
+1.461
5.08%
jan 1, 2012
31.123
+0.883
2.92%
jan 1, 2013
32.212
+1.089
3.5%
jan 1, 2014
32.983
+0.77
2.39%
jan 1, 2015
33.274
+0.291
0.88%
Ranking of countries by current statistics by years


Comments: