29
/
en
AIzaSyAYiBZKx7MnpbEhh9jyipgxe19OcubqV5w
April 1, 2024
48541
Middle East & North Africa
MEA
false
2
1
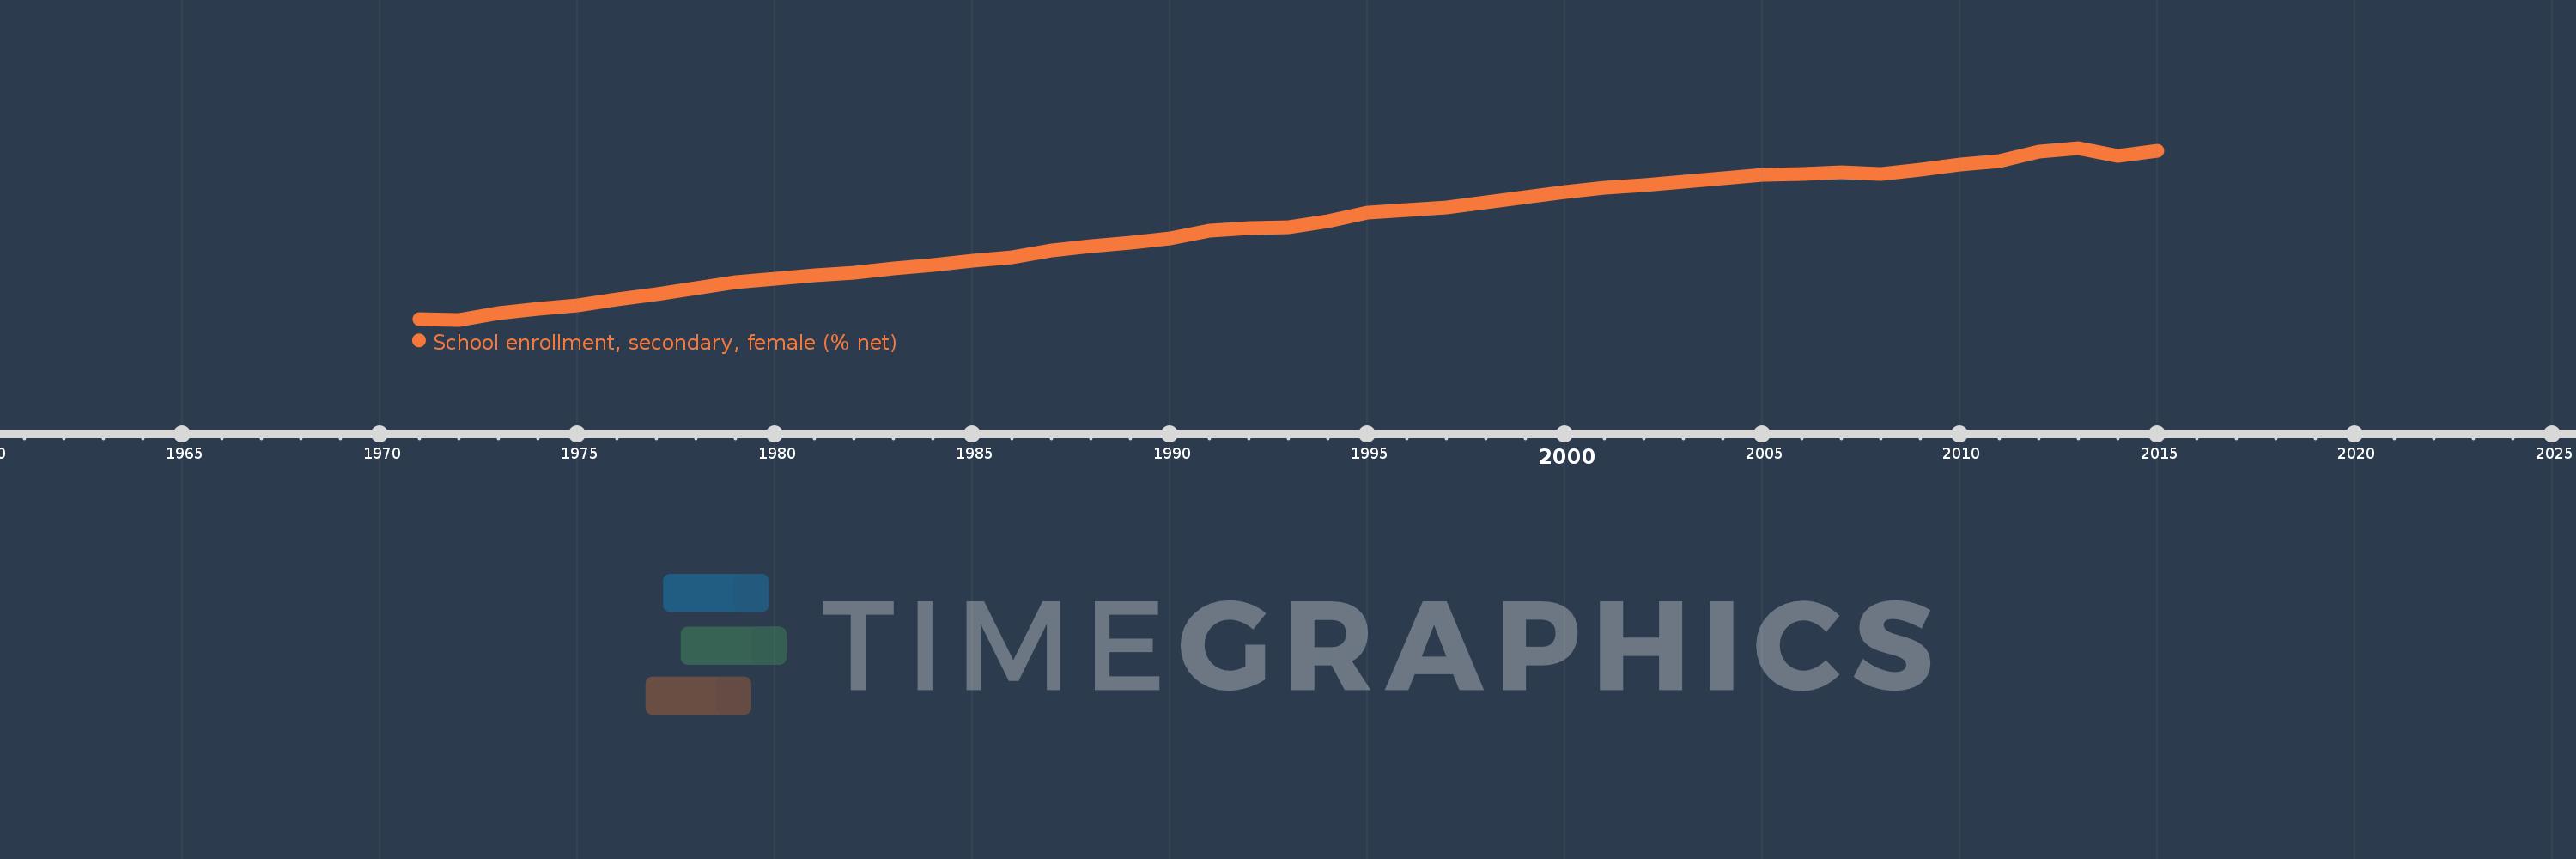
School enrollment, secondary, female (% net)
2015,2014,2013,2012,2011,2010,2009,2008,2007,2006,2005,2004,2003,2002,2001,2000,1999,1998,1997,1996,1995,1994,1993,1992,1991,1990,1989,1988,1987,1986,1985,1984,1983,1982,1981,1980,1979,1978,1977,1976,1975,1974,1973,1972,1971
This statistics in other country:
AfghanistanAlbaniaAlgeriaAngolaAntigua and BarbudaArab WorldArgentinaArmeniaArubaAustraliaAzerbaijanBahamas, TheBahrainBangladeshBarbadosBelarusBelgiumBelizeBeninBermudaBhutanBoliviaBotswanaBrazilBrunei DarussalamBulgariaBurkina FasoBurundiCabo VerdeCambodiaCameroonCanadaCaribbean small statesCentral African RepublicCentral Europe and the BalticsChadChileColombiaComorosCongo, Dem. Rep.Congo, Rep.Costa RicaCroatiaCubaCyprusDenmarkDjiboutiDominicaDominican RepublicEarly-demographic dividendEast Asia & PacificEast Asia & Pacific (excluding high income)East Asia & Pacific (IDA & IBRD countries)EcuadorEgypt, Arab Rep.El SalvadorEquatorial GuineaEritreaEstoniaEthiopiaEuro areaEurope & Central AsiaEurope & Central Asia (excluding high income)Europe & Central Asia (IDA & IBRD countries)European UnionFijiFinlandFragile and conflict affected situationsFranceGambia, TheGeorgiaGhanaGreeceGrenadaGuatemalaGuineaGuinea-BissauGuyanaHeavily indebted poor countries (HIPC)High incomeHondurasHong Kong SAR, ChinaHungaryIBRD onlyIcelandIDA & IBRD totalIDA blendIDA onlyIDA totalIndiaIndonesiaIran, Islamic Rep.IraqIrelandIsraelItalyJamaicaJapanJordanKazakhstanKenyaKiribatiKorea, Rep.KuwaitKyrgyz RepublicLao PDRLate-demographic dividendLatin America & Caribbean Latin America & Caribbean (excluding high income)Latin America & the Caribbean (IDA & IBRD countries)LatviaLeast developed countries: UN classificationLebanonLesothoLibyaLiechtensteinLithuaniaLow & middle incomeLow incomeLower middle incomeLuxembourgMacao SAR, ChinaMacedonia, FYRMadagascarMalawiMaldivesMaliMaltaMarshall IslandsMauritaniaMauritiusMexicoMiddle East & North AfricaMiddle East & North Africa (excluding high income)Middle East & North Africa (IDA & IBRD countries)Middle incomeMoldovaMongoliaMoroccoMozambiqueMyanmarNamibiaNauruNepalNetherlandsNew ZealandNicaraguaNigerNorth AmericaNorwayOECD membersOmanOther small statesPacific island small statesPakistanPanamaParaguayPeruPhilippinesPolandPortugalPost-demographic dividendPre-demographic dividendPuerto RicoQatarRomaniaSamoaSao Tome and PrincipeSaudi ArabiaSenegalSerbiaSeychellesSierra LeoneSloveniaSmall statesSolomon IslandsSomaliaSouth AfricaSouth AsiaSouth Asia (IDA & IBRD)SpainSri LankaSt. Kitts and NevisSt. LuciaSt. Vincent and the GrenadinesSub-Saharan Africa Sub-Saharan Africa (excluding high income)Sub-Saharan Africa (IDA & IBRD countries)SurinameSwazilandSwedenSwitzerlandSyrian Arab RepublicTajikistanThailandTimor-LesteTogoTongaTrinidad and TobagoTunisiaTurkeyTuvaluUgandaUkraineUnited Arab EmiratesUnited KingdomUnited StatesUpper middle incomeUruguayVanuatuVenezuela, RBWest Bank and GazaWorldYemen, Rep.Zimbabwe Timeline:
This timeline shows a graph from 1971 to 2015 of Middle East & North Africa. No data until 1970. Number of actual observations by date: 45.
Source name:
World Development Indicators
Source organization:
United Nations Educational, Scientific, and Cultural Organization (UNESCO) Institute for Statistics.
Categories, topics:
Education, Gender
Last updated:
apr 23, 2017
Indicators value changes by year
Minimum:
17.838
jan 1, 1972
Maximum:
70.274
jan 1, 2013
At the date of observation
Value
Absolute change
Change from previous value
jan 1, 1971
17.895
+17.895
0.0%
jan 1, 1972
17.838
-0.057
-0.32%
jan 1, 1973
19.893
+2.056
11.52%
jan 1, 1974
21.233
+1.34
6.73%
jan 1, 1975
22.205
+0.972
4.58%
jan 1, 1976
23.969
+1.764
7.95%
jan 1, 1977
25.723
+1.754
7.32%
jan 1, 1978
27.529
+1.806
7.02%
jan 1, 1979
29.347
+1.818
6.61%
jan 1, 1980
30.432
+1.085
3.7%
jan 1, 1981
31.406
+0.974
3.2%
jan 1, 1982
32.206
+0.8
2.55%
jan 1, 1983
33.518
+1.312
4.07%
jan 1, 1984
34.595
+1.077
3.21%
jan 1, 1985
35.742
+1.147
3.32%
jan 1, 1986
37.0
+1.258
3.52%
jan 1, 1987
38.869
+1.869
5.05%
jan 1, 1988
40.299
+1.429
3.68%
jan 1, 1989
41.287
+0.988
2.45%
jan 1, 1990
42.648
+1.361
3.3%
jan 1, 1991
45.142
+2.494
5.85%
jan 1, 1992
45.863
+0.721
1.6%
jan 1, 1993
46.195
+0.332
0.72%
jan 1, 1994
48.009
+1.814
3.93%
jan 1, 1995
50.65
+2.641
5.5%
jan 1, 1996
51.425
+0.775
1.53%
jan 1, 1997
52.062
+0.637
1.24%
jan 1, 1998
53.708
+1.646
3.16%
jan 1, 1999
55.304
+1.596
2.97%
jan 1, 2000
56.926
+1.621
2.93%
jan 1, 2001
58.042
+1.116
1.96%
jan 1, 2002
59.035
+0.993
1.71%
jan 1, 2003
59.858
+0.823
1.39%
jan 1, 2004
61.129
+1.271
2.12%
jan 1, 2005
62.152
+1.023
1.67%
jan 1, 2006
62.29
+0.138
0.22%
jan 1, 2007
62.829
+0.539
0.87%
jan 1, 2008
62.353
-0.476
-0.76%
jan 1, 2009
63.609
+1.256
2.01%
jan 1, 2010
65.283
+1.674
2.63%
jan 1, 2011
66.258
+0.975
1.49%
jan 1, 2012
69.156
+2.899
4.37%
jan 1, 2013
70.274
+1.118
1.62%
jan 1, 2014
67.93
-2.344
-3.34%
jan 1, 2015
69.304
+1.373
2.02%
Ranking of countries by current statistics by years


Comments: