29
/pt/
pt
AIzaSyAYiBZKx7MnpbEhh9jyipgxe19OcubqV5w
April 1, 2024
94459
Burkina Faso
BFA
true
2
1
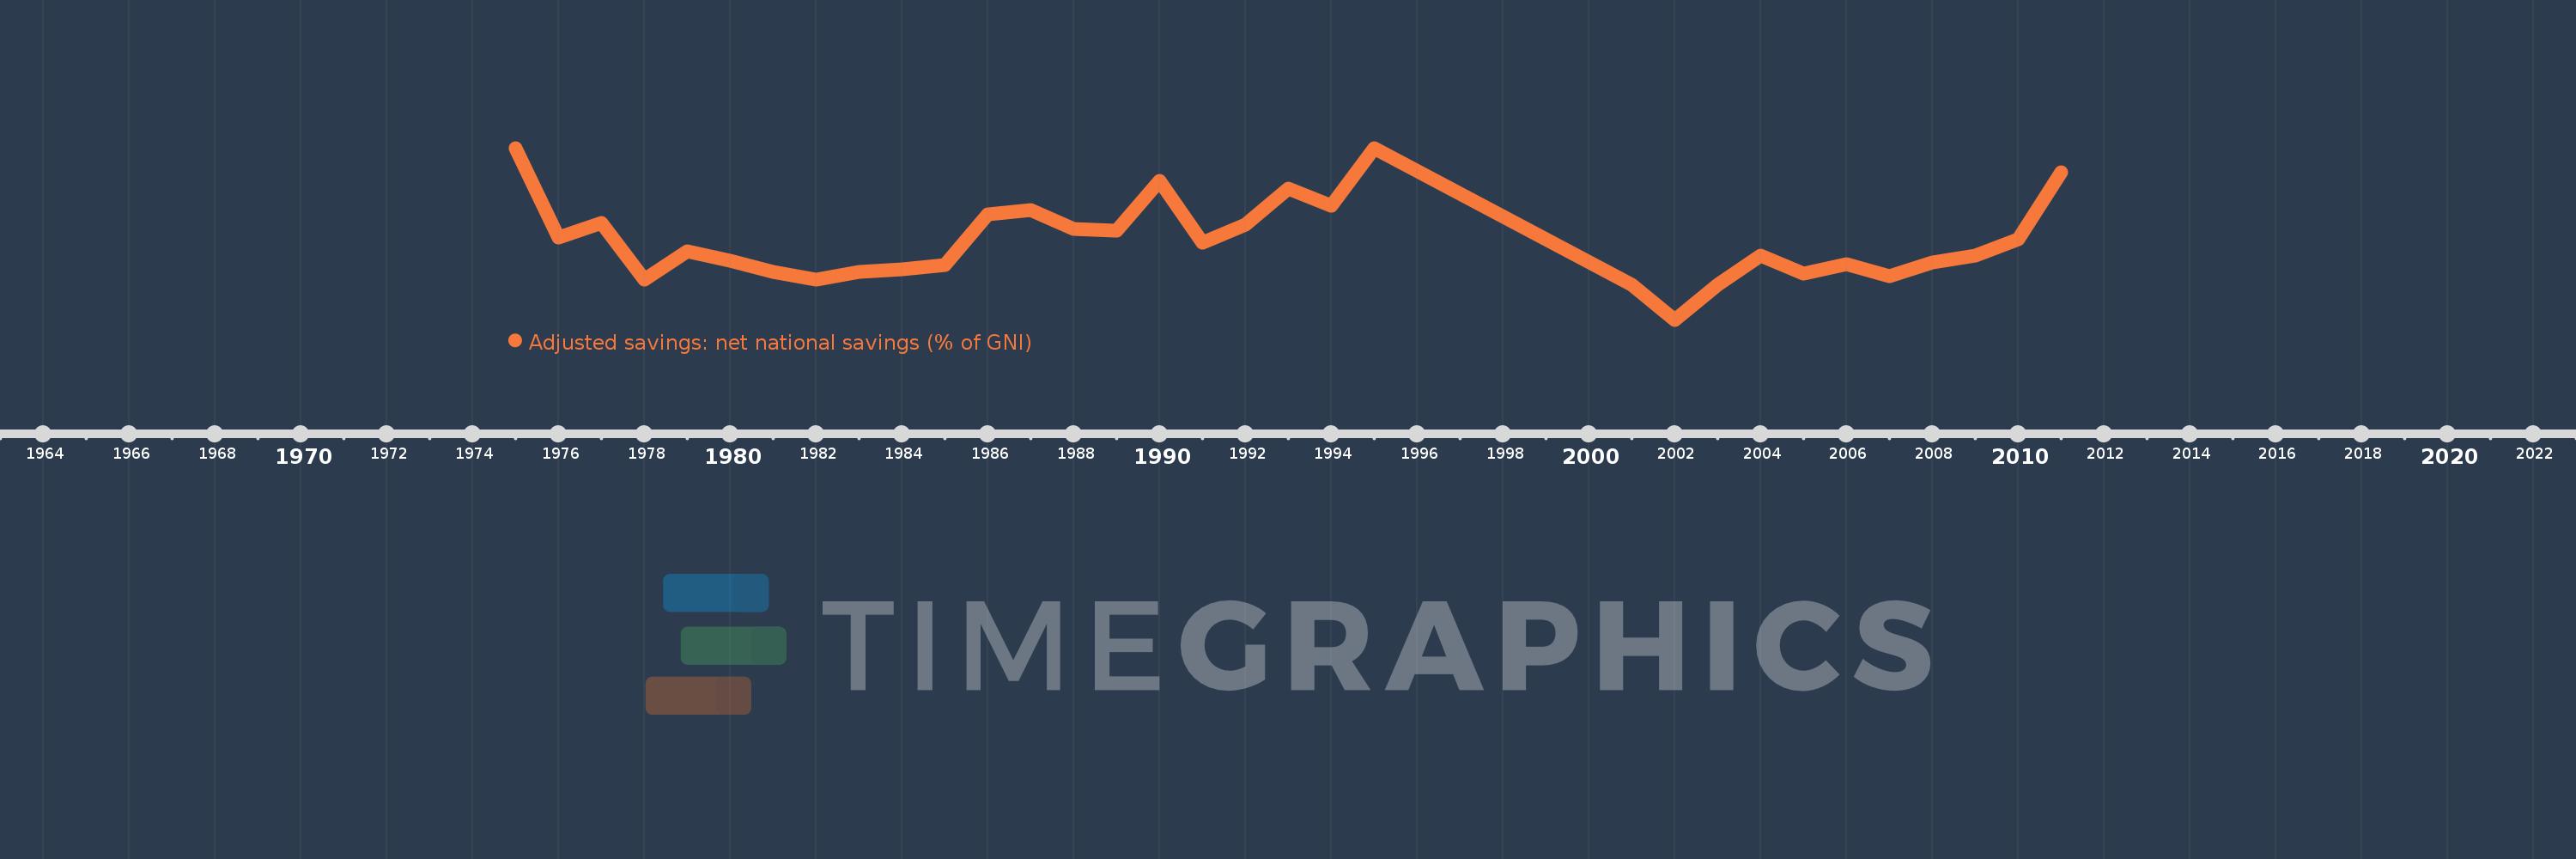
Adjusted savings: net national savings (% of GNI)
2011,2010,2009,2008,2007,2006,2005,2004,2003,2002,2001,1995,1994,1993,1992,1991,1990,1989,1988,1987,1986,1985,1984,1983,1982,1981,1980,1979,1978,1977,1976,1975
Estas estatísticas em outros países:
AfghanistanAlbaniaAlgeriaAngolaAntigua and BarbudaArab WorldArgentinaArmeniaAustraliaAustriaAzerbaijanBahamas, TheBahrainBangladeshBarbadosBelarusBelgiumBelizeBeninBermudaBhutanBoliviaBosnia and HerzegovinaBotswanaBrazilBrunei DarussalamBulgariaBurkina FasoBurundiCabo VerdeCambodiaCameroonCanadaCaribbean small statesCentral African RepublicCentral Europe and the BalticsChadChileChinaColombiaComorosCongo, Dem. Rep.Congo, Rep.Costa RicaCote d'IvoireCroatiaCyprusCzech RepublicDenmarkDjiboutiDominicaDominican RepublicEarly-demographic dividendEast Asia & PacificEast Asia & Pacific (excluding high income)East Asia & Pacific (IDA & IBRD countries)EcuadorEgypt, Arab Rep.El SalvadorEquatorial GuineaEritreaEstoniaEthiopiaEuro areaEurope & Central AsiaEurope & Central Asia (excluding high income)Europe & Central Asia (IDA & IBRD countries)European UnionFijiFinlandFragile and conflict affected situationsFranceGabonGambia, TheGeorgiaGermanyGhanaGreeceGrenadaGuatemalaGuineaGuinea-BissauGuyanaHaitiHeavily indebted poor countries (HIPC)High incomeHondurasHong Kong SAR, ChinaHungaryIBRD onlyIcelandIDA & IBRD totalIDA blendIDA onlyIDA totalIndiaIndonesiaIran, Islamic Rep.IraqIrelandIsraelItalyJamaicaJapanJordanKazakhstanKenyaKiribatiKorea, Rep.KosovoKuwaitKyrgyz RepublicLao PDRLate-demographic dividendLatin America & Caribbean Latin America & Caribbean (excluding high income)Latin America & the Caribbean (IDA & IBRD countries)LatviaLeast developed countries: UN classificationLebanonLesothoLiberiaLibyaLithuaniaLow & middle incomeLow incomeLower middle incomeLuxembourgMacao SAR, ChinaMacedonia, FYRMadagascarMalawiMalaysiaMaldivesMaliMaltaMauritaniaMauritiusMexicoMiddle East & North AfricaMiddle East & North Africa (excluding high income)Middle East & North Africa (IDA & IBRD countries)Middle incomeMoldovaMongoliaMontenegroMoroccoMozambiqueNamibiaNepalNetherlandsNew ZealandNicaraguaNigerNigeriaNorth AmericaNorwayOECD membersOmanOther small statesPacific island small statesPakistanPanamaPapua New GuineaParaguayPeruPhilippinesPolandPortugalPost-demographic dividendPre-demographic dividendQatarRomaniaRussian FederationRwandaSaudi ArabiaSenegalSerbiaSeychellesSierra LeoneSingaporeSlovak RepublicSloveniaSmall statesSolomon IslandsSouth AfricaSouth AsiaSouth Asia (IDA & IBRD)SpainSri LankaSt. Kitts and NevisSt. LuciaSt. Vincent and the GrenadinesSub-Saharan Africa Sub-Saharan Africa (excluding high income)Sub-Saharan Africa (IDA & IBRD countries)SudanSurinameSwazilandSwedenSwitzerlandSyrian Arab RepublicTajikistanTanzaniaThailandTimor-LesteTogoTongaTrinidad and TobagoTunisiaTurkeyTurkmenistanUgandaUkraineUnited KingdomUnited StatesUpper middle incomeUruguayVanuatuVenezuela, RBVietnamWest Bank and GazaWorldYemen, Rep.ZambiaZimbabwe Linha do tempo:
Nesta escala de tempo está apresentado um gráfico de 1975 ano até 2011 ano Burkina Faso. Dados de 1974 ano ausente. O número de observações reais por data: 32.
Fonte (nome):
Indicadores de desenvolvimento mundial
Fonte (organização):
World Bank staff estimates based on sources and methods in World Bank's "The Changing Wealth of Nations: Measuring Sustainable Development in the New Millennium" (2011).
Categorias:
Economy & Growth, Environment
Foi atualizado:
23 abr 2017 ano
Indicadores de alterações dos valores ao longo dos anos
Mínimo:
-2.887
1 jan 2002 ano
Máximo:
20.983
1 jan 1995 ano
Na data de observação
Valor
Mudança absoluta
A alteração em relação ao valor anterior
1 jan 1975 ano
20.907
+20.907
0.0%
1 jan 1976 ano
8.566
-12.341
-59.03%
1 jan 1977 ano
10.615
+2.05
23.93%
1 jan 1978 ano
2.732
-7.884
-74.27%
1 jan 1979 ano
6.679
+3.948
144.52%
1 jan 1980 ano
5.359
-1.32
-19.76%
1 jan 1981 ano
3.772
-1.587
-29.61%
1 jan 1982 ano
2.739
-1.034
-27.41%
1 jan 1983 ano
3.766
+1.027
37.51%
1 jan 1984 ano
4.063
+0.297
7.9%
1 jan 1985 ano
4.7
+0.637
15.68%
1 jan 1986 ano
11.807
+7.107
151.21%
1 jan 1987 ano
12.32
+0.512
4.34%
1 jan 1988 ano
9.761
-2.559
-20.77%
1 jan 1989 ano
9.474
-0.287
-2.94%
1 jan 1990 ano
16.41
+6.936
73.22%
1 jan 1991 ano
7.775
-8.635
-52.62%
1 jan 1992 ano
10.378
+2.603
33.48%
1 jan 1993 ano
15.341
+4.963
47.83%
1 jan 1994 ano
12.909
-2.432
-15.85%
1 jan 1995 ano
20.983
+8.074
62.55%
1 jan 2001 ano
1.986
-18.997
-90.54%
1 jan 2002 ano
-2.887
-4.873
-245.36%
1 jan 2003 ano
1.962
+4.849
-167.96%
1 jan 2004 ano
6.042
+4.08
207.97%
1 jan 2005 ano
3.485
-2.557
-42.32%
1 jan 2006 ano
4.83
+1.345
38.6%
1 jan 2007 ano
3.13
-1.701
-35.21%
1 jan 2008 ano
5.089
+1.96
62.61%
1 jan 2009 ano
6.08
+0.991
19.47%
1 jan 2010 ano
8.322
+2.242
36.87%
1 jan 2011 ano
17.605
+9.283
111.54%
Classificação de países por estatísticas atuais por anos


Comentários: