29
/pt/
pt
AIzaSyAYiBZKx7MnpbEhh9jyipgxe19OcubqV5w
April 1, 2024
31282
Europe & Central Asia (excluding high income)
ECA
false
2
1
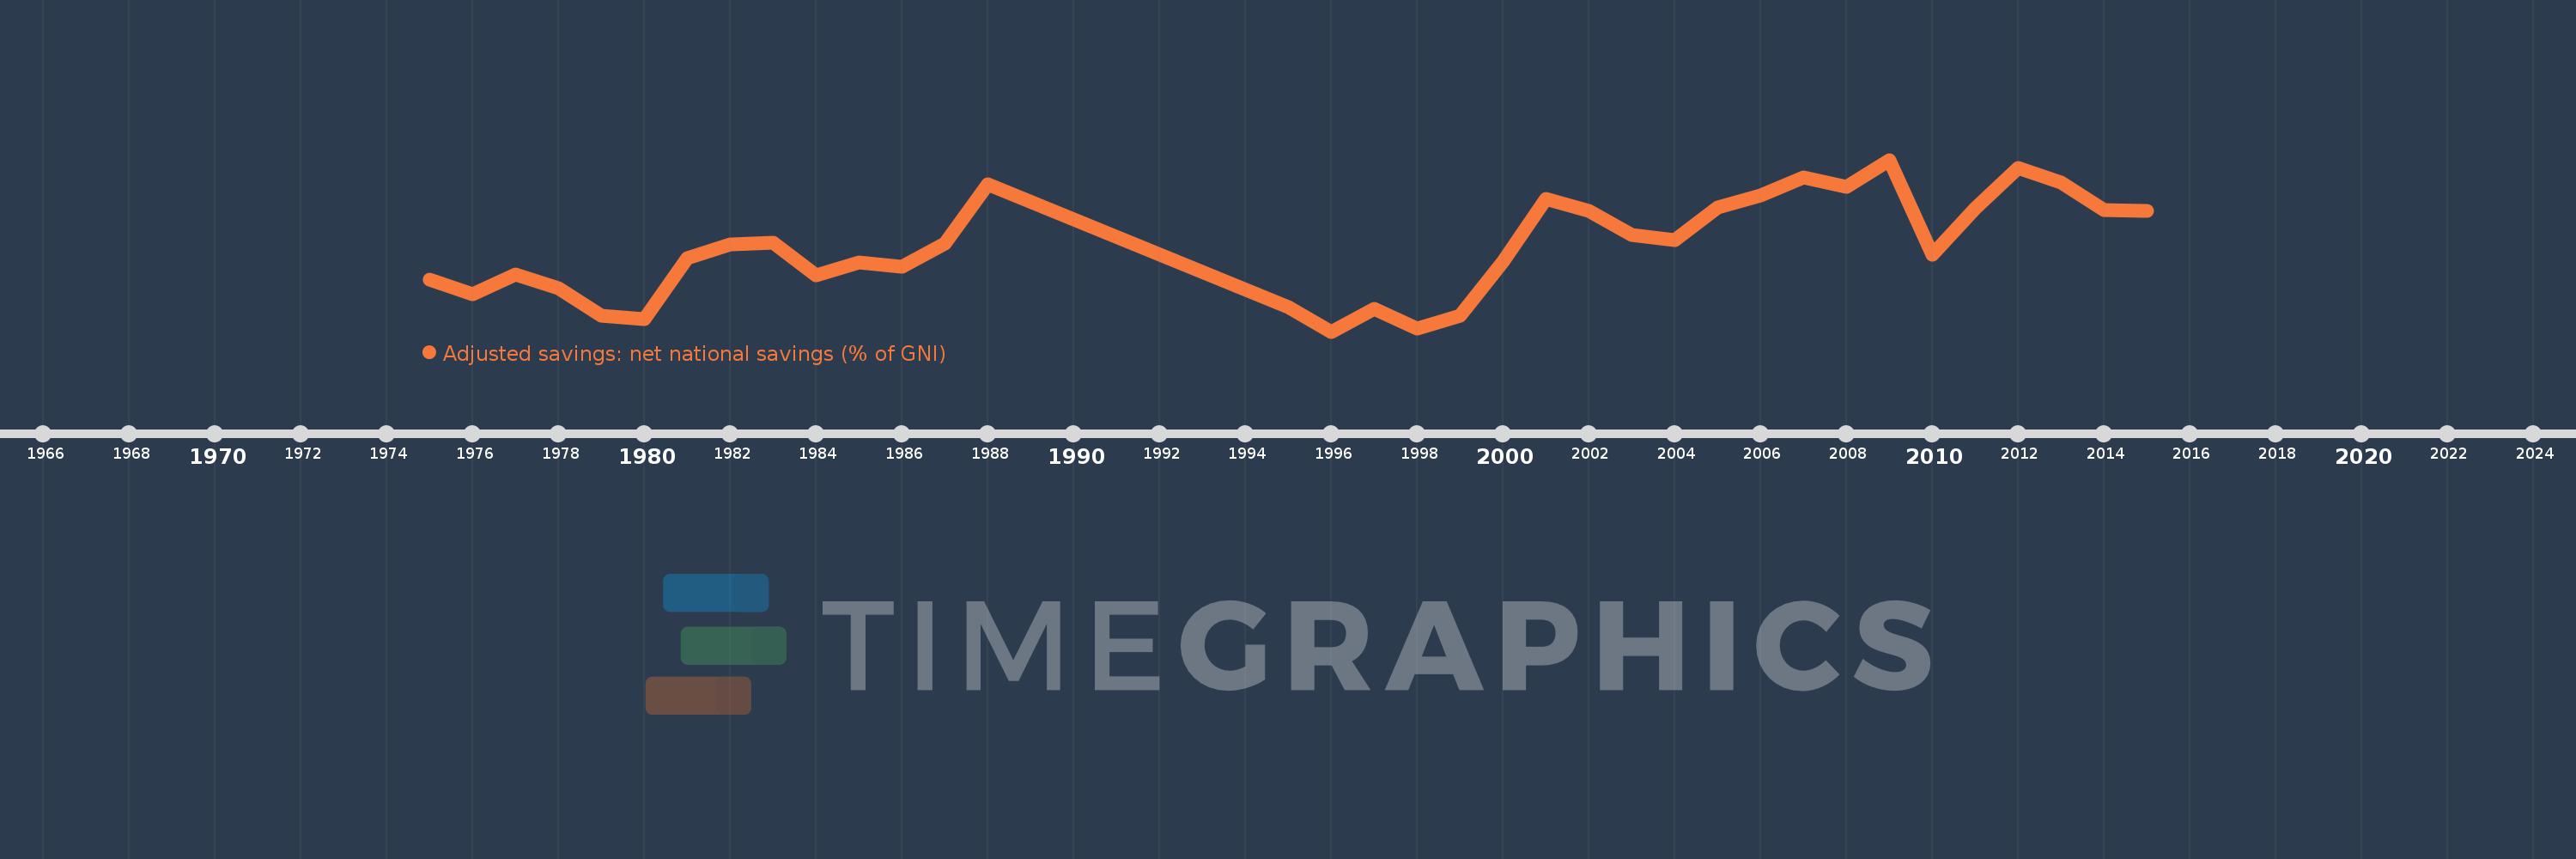
Adjusted savings: net national savings (% of GNI)
2015,2014,2013,2012,2011,2010,2009,2008,2007,2006,2005,2004,2003,2002,2001,2000,1999,1998,1997,1996,1995,1988,1987,1986,1985,1984,1983,1982,1981,1980,1979,1978,1977,1976,1975
Estas estatísticas em outros países:
AfghanistanAlbaniaAlgeriaAngolaAntigua and BarbudaArab WorldArgentinaArmeniaAustraliaAustriaAzerbaijanBahamas, TheBahrainBangladeshBarbadosBelarusBelgiumBelizeBeninBermudaBhutanBoliviaBosnia and HerzegovinaBotswanaBrazilBrunei DarussalamBulgariaBurkina FasoBurundiCabo VerdeCambodiaCameroonCanadaCaribbean small statesCentral African RepublicCentral Europe and the BalticsChadChileChinaColombiaComorosCongo, Dem. Rep.Congo, Rep.Costa RicaCote d'IvoireCroatiaCyprusCzech RepublicDenmarkDjiboutiDominicaDominican RepublicEarly-demographic dividendEast Asia & PacificEast Asia & Pacific (excluding high income)East Asia & Pacific (IDA & IBRD countries)EcuadorEgypt, Arab Rep.El SalvadorEquatorial GuineaEritreaEstoniaEthiopiaEuro areaEurope & Central AsiaEurope & Central Asia (excluding high income)Europe & Central Asia (IDA & IBRD countries)European UnionFijiFinlandFragile and conflict affected situationsFranceGabonGambia, TheGeorgiaGermanyGhanaGreeceGrenadaGuatemalaGuineaGuinea-BissauGuyanaHaitiHeavily indebted poor countries (HIPC)High incomeHondurasHong Kong SAR, ChinaHungaryIBRD onlyIcelandIDA & IBRD totalIDA blendIDA onlyIDA totalIndiaIndonesiaIran, Islamic Rep.IraqIrelandIsraelItalyJamaicaJapanJordanKazakhstanKenyaKiribatiKorea, Rep.KosovoKuwaitKyrgyz RepublicLao PDRLate-demographic dividendLatin America & Caribbean Latin America & Caribbean (excluding high income)Latin America & the Caribbean (IDA & IBRD countries)LatviaLeast developed countries: UN classificationLebanonLesothoLiberiaLibyaLithuaniaLow & middle incomeLow incomeLower middle incomeLuxembourgMacao SAR, ChinaMacedonia, FYRMadagascarMalawiMalaysiaMaldivesMaliMaltaMauritaniaMauritiusMexicoMiddle East & North AfricaMiddle East & North Africa (excluding high income)Middle East & North Africa (IDA & IBRD countries)Middle incomeMoldovaMongoliaMontenegroMoroccoMozambiqueNamibiaNepalNetherlandsNew ZealandNicaraguaNigerNigeriaNorth AmericaNorwayOECD membersOmanOther small statesPacific island small statesPakistanPanamaPapua New GuineaParaguayPeruPhilippinesPolandPortugalPost-demographic dividendPre-demographic dividendQatarRomaniaRussian FederationRwandaSaudi ArabiaSenegalSerbiaSeychellesSierra LeoneSingaporeSlovak RepublicSloveniaSmall statesSolomon IslandsSouth AfricaSouth AsiaSouth Asia (IDA & IBRD)SpainSri LankaSt. Kitts and NevisSt. LuciaSt. Vincent and the GrenadinesSub-Saharan Africa Sub-Saharan Africa (excluding high income)Sub-Saharan Africa (IDA & IBRD countries)SudanSurinameSwazilandSwedenSwitzerlandSyrian Arab RepublicTajikistanTanzaniaThailandTimor-LesteTogoTongaTrinidad and TobagoTunisiaTurkeyTurkmenistanUgandaUkraineUnited KingdomUnited StatesUpper middle incomeUruguayVanuatuVenezuela, RBVietnamWest Bank and GazaWorldYemen, Rep.ZambiaZimbabwe Linha do tempo:
Nesta escala de tempo está apresentado um gráfico de 1975 ano até 2015 ano Europe & Central Asia (excluding high income). Dados de 1974 ano ausente. O número de observações reais por data: 35.
Fonte (nome):
Indicadores de desenvolvimento mundial
Fonte (organização):
World Bank staff estimates based on sources and methods in World Bank's "The Changing Wealth of Nations: Measuring Sustainable Development in the New Millennium" (2011).
Categorias:
Economy & Growth, Environment
Foi atualizado:
23 abr 2017 ano
Indicadores de alterações dos valores ao longo dos anos
Mínimo:
6.354
1 jan 1996 ano
Máximo:
19.445
1 jan 2009 ano
Na data de observação
Valor
Mudança absoluta
A alteração em relação ao valor anterior
1 jan 1975 ano
10.308
+10.308
0.0%
1 jan 1976 ano
9.227
-1.081
-10.48%
1 jan 1977 ano
10.72
+1.493
16.18%
1 jan 1978 ano
9.691
-1.029
-9.6%
1 jan 1979 ano
7.543
-2.148
-22.17%
1 jan 1980 ano
7.309
-0.233
-3.09%
1 jan 1981 ano
11.979
+4.67
63.89%
1 jan 1982 ano
12.968
+0.989
8.26%
1 jan 1983 ano
13.11
+0.142
1.1%
1 jan 1984 ano
10.614
-2.497
-19.04%
1 jan 1985 ano
11.654
+1.04
9.8%
1 jan 1986 ano
11.315
-0.339
-2.91%
1 jan 1987 ano
13.093
+1.778
15.72%
1 jan 1988 ano
17.61
+4.517
34.5%
1 jan 1995 ano
8.21
-9.4
-53.38%
1 jan 1996 ano
6.354
-1.857
-22.61%
1 jan 1997 ano
8.098
+1.744
27.45%
1 jan 1998 ano
6.592
-1.506
-18.59%
1 jan 1999 ano
7.587
+0.995
15.09%
1 jan 2000 ano
11.696
+4.109
54.16%
1 jan 2001 ano
16.458
+4.763
40.72%
1 jan 2002 ano
15.571
-0.887
-5.39%
1 jan 2003 ano
13.688
-1.883
-12.09%
1 jan 2004 ano
13.297
-0.391
-2.85%
1 jan 2005 ano
15.803
+2.506
18.84%
1 jan 2006 ano
16.754
+0.951
6.02%
1 jan 2007 ano
18.091
+1.337
7.98%
1 jan 2008 ano
17.372
-0.719
-3.97%
1 jan 2009 ano
19.445
+2.073
11.93%
1 jan 2010 ano
12.227
-7.218
-37.12%
1 jan 2011 ano
15.763
+3.536
28.92%
1 jan 2012 ano
18.793
+3.03
19.22%
1 jan 2013 ano
17.719
-1.075
-5.72%
1 jan 2014 ano
15.627
-2.092
-11.81%
1 jan 2015 ano
15.539
-0.088
-0.56%
Classificação de países por estatísticas atuais por anos


Comentários: