29
/pt/
pt
AIzaSyAYiBZKx7MnpbEhh9jyipgxe19OcubqV5w
April 1, 2024
123085
Ecuador
ECU
true
2
1
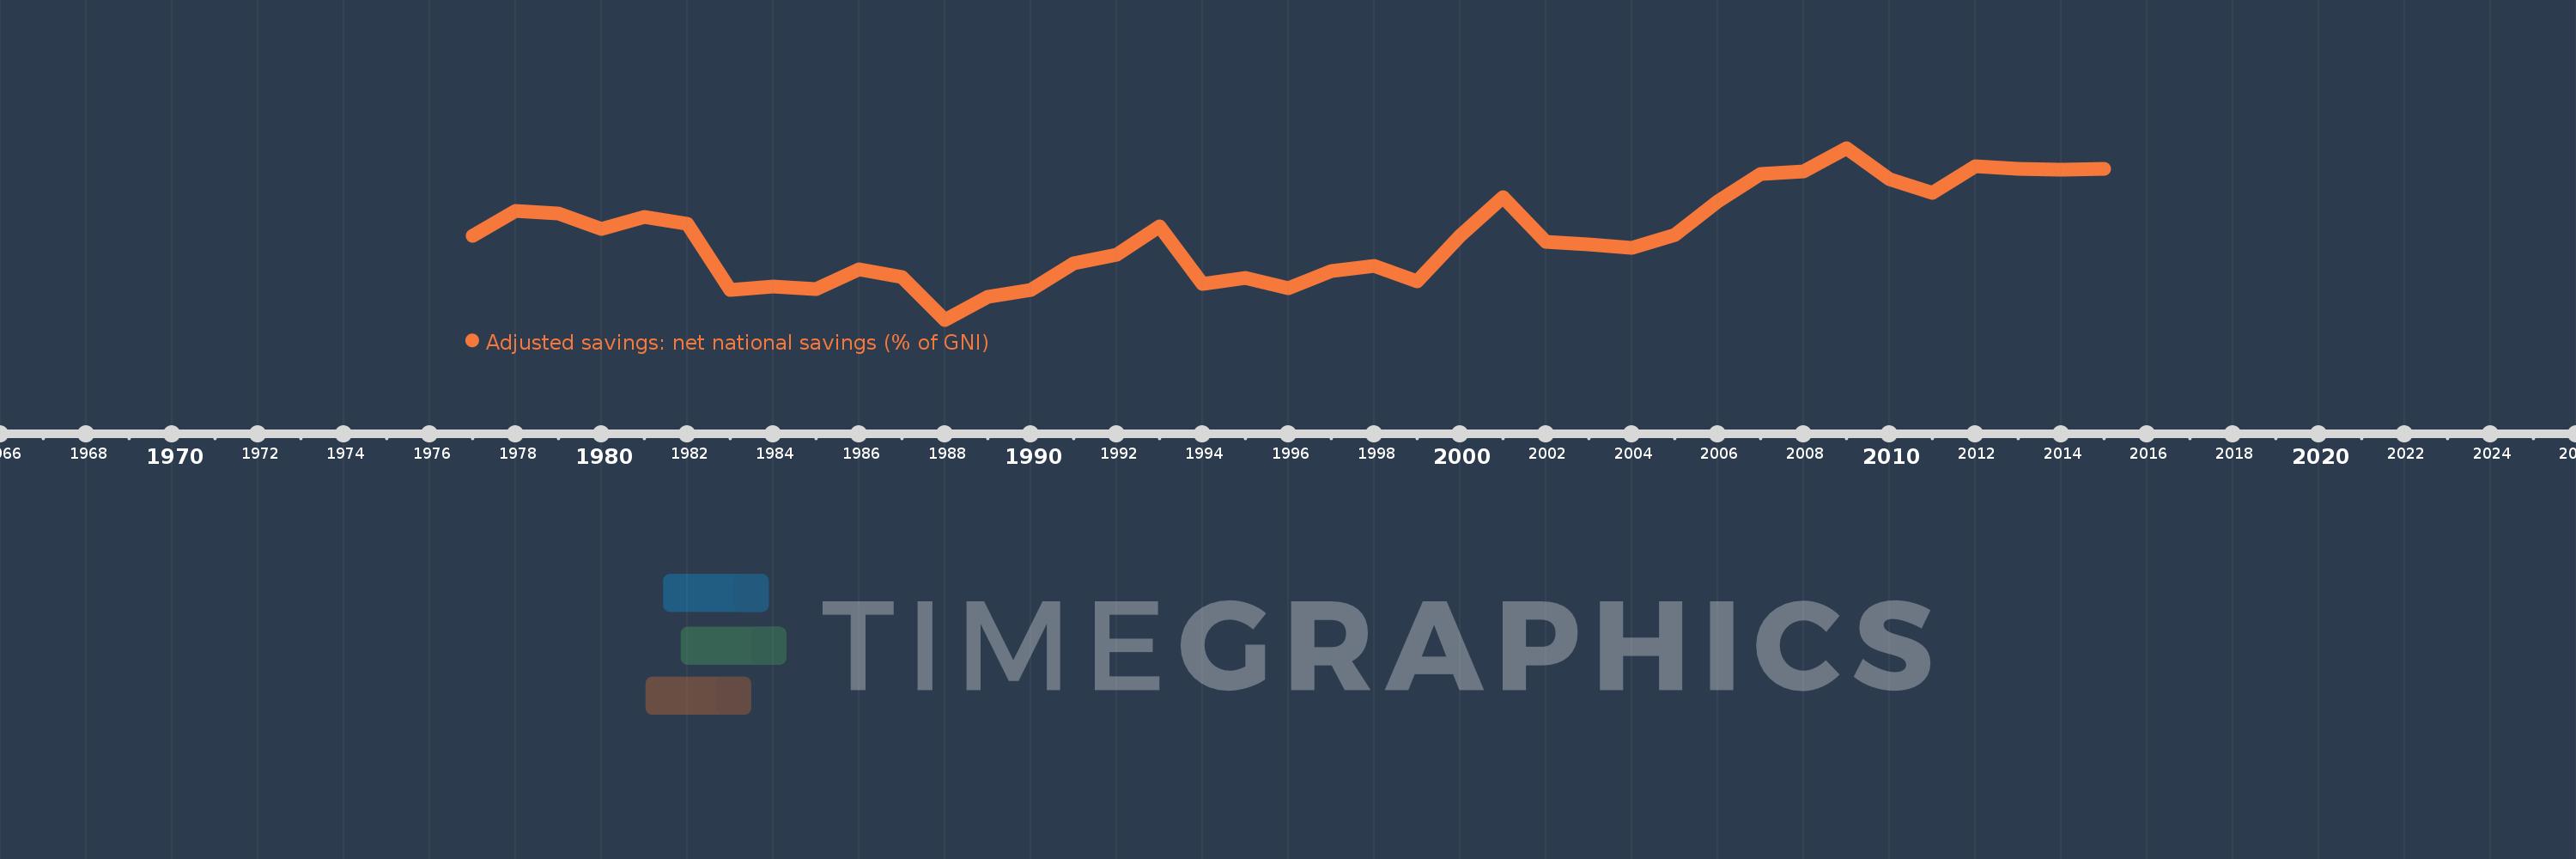
Adjusted savings: net national savings (% of GNI)
2015,2014,2013,2012,2011,2010,2009,2008,2007,2006,2005,2004,2003,2002,2001,2000,1999,1998,1997,1996,1995,1994,1993,1992,1991,1990,1989,1988,1987,1986,1985,1984,1983,1982,1981,1980,1979,1978,1977
Estas estatísticas em outros países:
AfghanistanAlbaniaAlgeriaAngolaAntigua and BarbudaArab WorldArgentinaArmeniaAustraliaAustriaAzerbaijanBahamas, TheBahrainBangladeshBarbadosBelarusBelgiumBelizeBeninBermudaBhutanBoliviaBosnia and HerzegovinaBotswanaBrazilBrunei DarussalamBulgariaBurkina FasoBurundiCabo VerdeCambodiaCameroonCanadaCaribbean small statesCentral African RepublicCentral Europe and the BalticsChadChileChinaColombiaComorosCongo, Dem. Rep.Congo, Rep.Costa RicaCote d'IvoireCroatiaCyprusCzech RepublicDenmarkDjiboutiDominicaDominican RepublicEarly-demographic dividendEast Asia & PacificEast Asia & Pacific (excluding high income)East Asia & Pacific (IDA & IBRD countries)EcuadorEgypt, Arab Rep.El SalvadorEquatorial GuineaEritreaEstoniaEthiopiaEuro areaEurope & Central AsiaEurope & Central Asia (excluding high income)Europe & Central Asia (IDA & IBRD countries)European UnionFijiFinlandFragile and conflict affected situationsFranceGabonGambia, TheGeorgiaGermanyGhanaGreeceGrenadaGuatemalaGuineaGuinea-BissauGuyanaHaitiHeavily indebted poor countries (HIPC)High incomeHondurasHong Kong SAR, ChinaHungaryIBRD onlyIcelandIDA & IBRD totalIDA blendIDA onlyIDA totalIndiaIndonesiaIran, Islamic Rep.IraqIrelandIsraelItalyJamaicaJapanJordanKazakhstanKenyaKiribatiKorea, Rep.KosovoKuwaitKyrgyz RepublicLao PDRLate-demographic dividendLatin America & Caribbean Latin America & Caribbean (excluding high income)Latin America & the Caribbean (IDA & IBRD countries)LatviaLeast developed countries: UN classificationLebanonLesothoLiberiaLibyaLithuaniaLow & middle incomeLow incomeLower middle incomeLuxembourgMacao SAR, ChinaMacedonia, FYRMadagascarMalawiMalaysiaMaldivesMaliMaltaMauritaniaMauritiusMexicoMiddle East & North AfricaMiddle East & North Africa (excluding high income)Middle East & North Africa (IDA & IBRD countries)Middle incomeMoldovaMongoliaMontenegroMoroccoMozambiqueNamibiaNepalNetherlandsNew ZealandNicaraguaNigerNigeriaNorth AmericaNorwayOECD membersOmanOther small statesPacific island small statesPakistanPanamaPapua New GuineaParaguayPeruPhilippinesPolandPortugalPost-demographic dividendPre-demographic dividendQatarRomaniaRussian FederationRwandaSaudi ArabiaSenegalSerbiaSeychellesSierra LeoneSingaporeSlovak RepublicSloveniaSmall statesSolomon IslandsSouth AfricaSouth AsiaSouth Asia (IDA & IBRD)SpainSri LankaSt. Kitts and NevisSt. LuciaSt. Vincent and the GrenadinesSub-Saharan Africa Sub-Saharan Africa (excluding high income)Sub-Saharan Africa (IDA & IBRD countries)SudanSurinameSwazilandSwedenSwitzerlandSyrian Arab RepublicTajikistanTanzaniaThailandTimor-LesteTogoTongaTrinidad and TobagoTunisiaTurkeyTurkmenistanUgandaUkraineUnited KingdomUnited StatesUpper middle incomeUruguayVanuatuVenezuela, RBVietnamWest Bank and GazaWorldYemen, Rep.ZambiaZimbabwe Linha do tempo:
Nesta escala de tempo está apresentado um gráfico de 1977 ano até 2015 ano Ecuador. Dados de 1976 ano ausente. O número de observações reais por data: 39.
Fonte (nome):
Indicadores de desenvolvimento mundial
Fonte (organização):
World Bank staff estimates based on sources and methods in World Bank's "The Changing Wealth of Nations: Measuring Sustainable Development in the New Millennium" (2011).
Categorias:
Economy & Growth, Environment
Foi atualizado:
23 abr 2017 ano
Indicadores de alterações dos valores ao longo dos anos
Mínimo:
-3.975
1 jan 1988 ano
Máximo:
18.27
1 jan 2009 ano
Na data de observação
Valor
Mudança absoluta
A alteração em relação ao valor anterior
1 jan 1977 ano
6.844
+6.844
0.0%
1 jan 1978 ano
10.068
+3.224
47.11%
1 jan 1979 ano
9.819
-0.249
-2.47%
1 jan 1980 ano
7.767
-2.051
-20.89%
1 jan 1981 ano
9.392
+1.625
20.92%
1 jan 1982 ano
8.445
-0.947
-10.09%
1 jan 1983 ano
-0.088
-8.533
-101.05%
1 jan 1984 ano
0.38
+0.469
-530.25%
1 jan 1985 ano
0.019
-0.362
-95.06%
1 jan 1986 ano
2.565
+2.547
13.56 mil%
1 jan 1987 ano
1.527
-1.038
-40.46%
1 jan 1988 ano
-3.975
-5.502
-360.24%
1 jan 1989 ano
-0.971
+3.004
-75.56%
1 jan 1990 ano
-0.082
+0.889
-91.54%
1 jan 1991 ano
3.333
+3.415
-4.16 mil%
1 jan 1992 ano
4.5
+1.167
35.03%
1 jan 1993 ano
8.135
+3.635
80.78%
1 jan 1994 ano
0.628
-7.507
-92.28%
1 jan 1995 ano
1.431
+0.803
127.74%
1 jan 1996 ano
0.157
-1.275
-89.06%
1 jan 1997 ano
2.345
+2.188
1.4 mil%
1 jan 1998 ano
2.976
+0.631
26.92%
1 jan 1999 ano
1.024
-1.952
-65.58%
1 jan 2000 ano
6.935
+5.911
577.01%
1 jan 2001 ano
11.952
+5.017
72.35%
1 jan 2002 ano
6.126
-5.826
-48.74%
1 jan 2003 ano
5.831
-0.295
-4.82%
1 jan 2004 ano
5.281
-0.55
-9.44%
1 jan 2005 ano
7.031
+1.75
33.14%
1 jan 2006 ano
11.33
+4.3
61.16%
1 jan 2007 ano
14.847
+3.517
31.04%
1 jan 2008 ano
15.265
+0.418
2.82%
1 jan 2009 ano
18.27
+3.005
19.69%
1 jan 2010 ano
14.225
-4.046
-22.14%
1 jan 2011 ano
12.436
-1.789
-12.58%
1 jan 2012 ano
15.851
+3.416
27.47%
1 jan 2013 ano
15.579
-0.273
-1.72%
1 jan 2014 ano
15.457
-0.122
-0.78%
1 jan 2015 ano
15.609
+0.153
0.99%
Classificação de países por estatísticas atuais por anos


Comentários: