29
/pt/
pt
AIzaSyAYiBZKx7MnpbEhh9jyipgxe19OcubqV5w
April 1, 2024
142688
Grenada
GRD
true
2
1
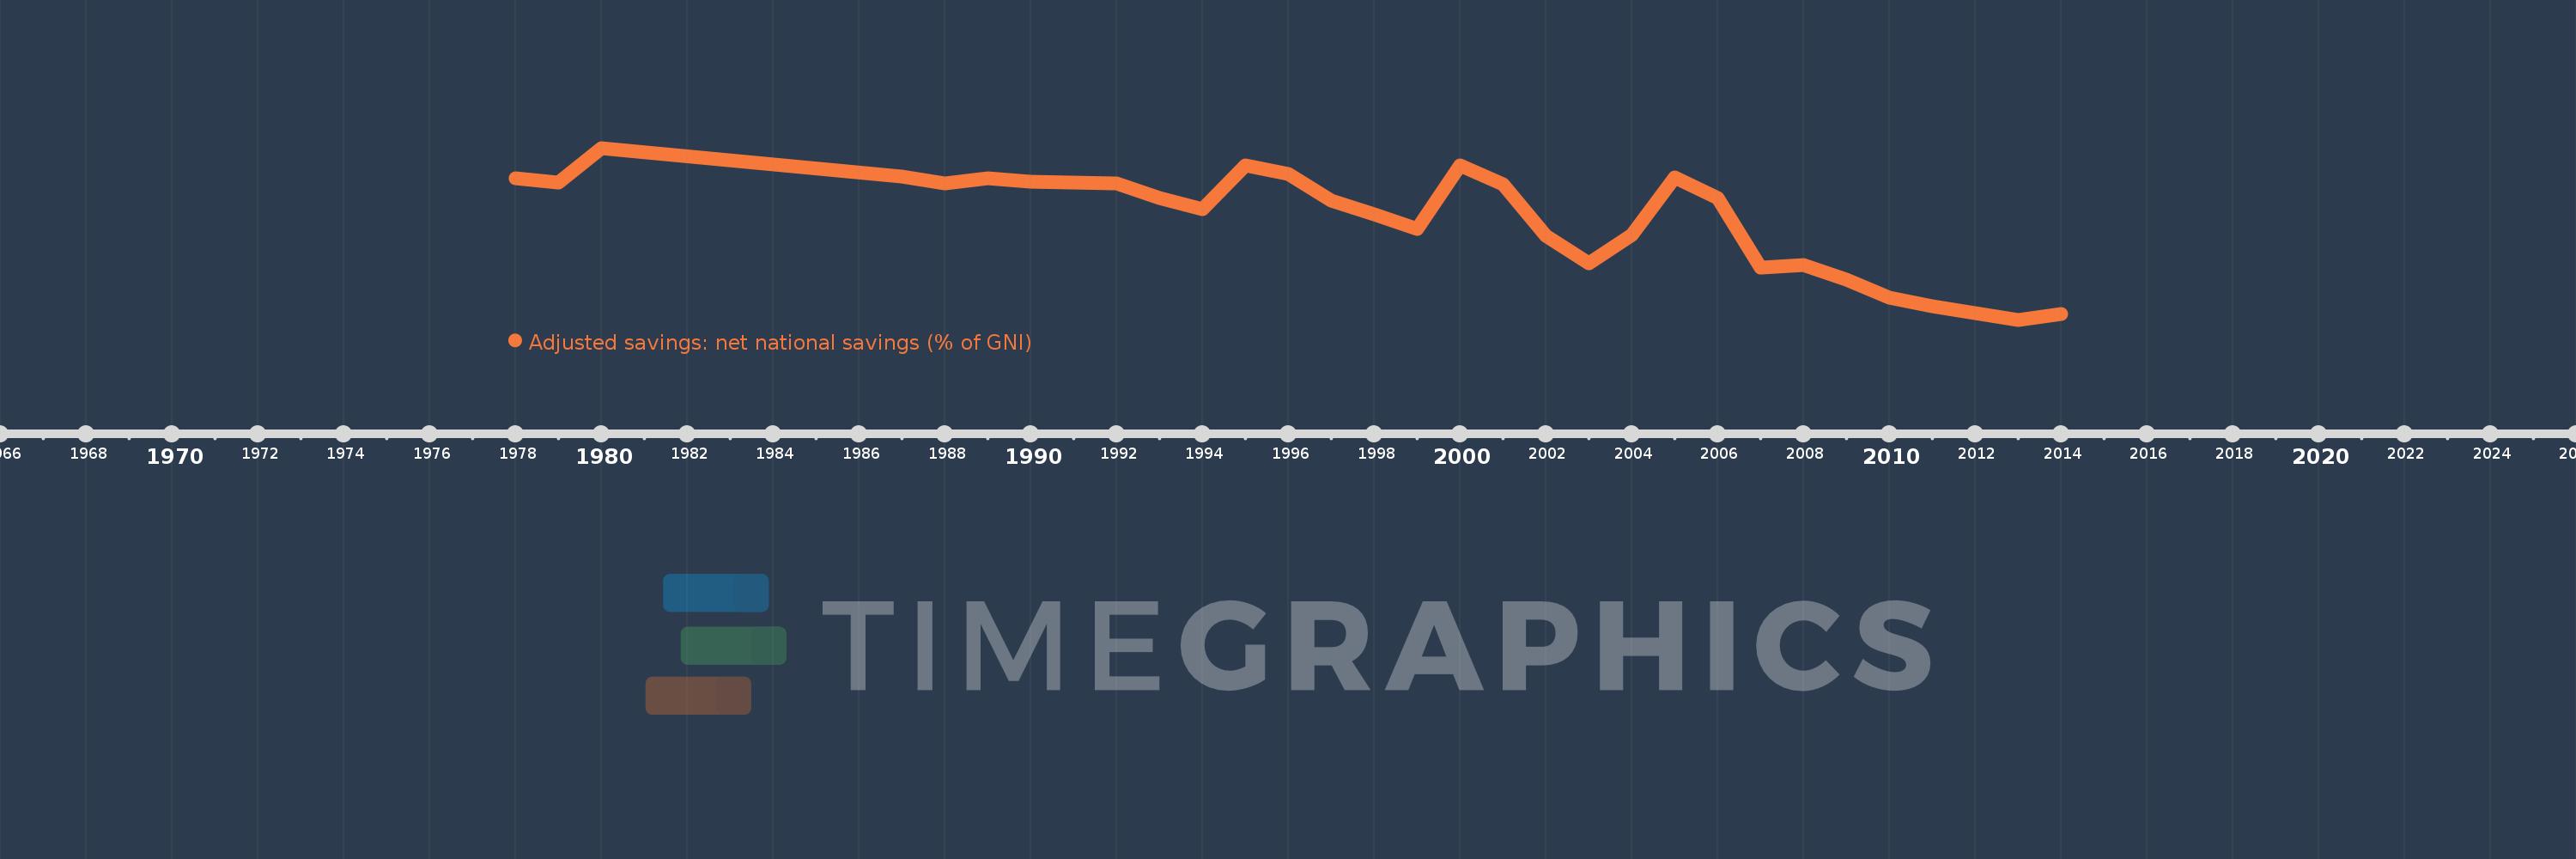
Adjusted savings: net national savings (% of GNI)
2014,2013,2012,2011,2010,2009,2008,2007,2006,2005,2004,2003,2002,2001,2000,1999,1998,1997,1996,1995,1994,1993,1992,1991,1990,1989,1988,1987,1980,1979,1978
Estas estatísticas em outros países:
AfghanistanAlbaniaAlgeriaAngolaAntigua and BarbudaArab WorldArgentinaArmeniaAustraliaAustriaAzerbaijanBahamas, TheBahrainBangladeshBarbadosBelarusBelgiumBelizeBeninBermudaBhutanBoliviaBosnia and HerzegovinaBotswanaBrazilBrunei DarussalamBulgariaBurkina FasoBurundiCabo VerdeCambodiaCameroonCanadaCaribbean small statesCentral African RepublicCentral Europe and the BalticsChadChileChinaColombiaComorosCongo, Dem. Rep.Congo, Rep.Costa RicaCote d'IvoireCroatiaCyprusCzech RepublicDenmarkDjiboutiDominicaDominican RepublicEarly-demographic dividendEast Asia & PacificEast Asia & Pacific (excluding high income)East Asia & Pacific (IDA & IBRD countries)EcuadorEgypt, Arab Rep.El SalvadorEquatorial GuineaEritreaEstoniaEthiopiaEuro areaEurope & Central AsiaEurope & Central Asia (excluding high income)Europe & Central Asia (IDA & IBRD countries)European UnionFijiFinlandFragile and conflict affected situationsFranceGabonGambia, TheGeorgiaGermanyGhanaGreeceGrenadaGuatemalaGuineaGuinea-BissauGuyanaHaitiHeavily indebted poor countries (HIPC)High incomeHondurasHong Kong SAR, ChinaHungaryIBRD onlyIcelandIDA & IBRD totalIDA blendIDA onlyIDA totalIndiaIndonesiaIran, Islamic Rep.IraqIrelandIsraelItalyJamaicaJapanJordanKazakhstanKenyaKiribatiKorea, Rep.KosovoKuwaitKyrgyz RepublicLao PDRLate-demographic dividendLatin America & Caribbean Latin America & Caribbean (excluding high income)Latin America & the Caribbean (IDA & IBRD countries)LatviaLeast developed countries: UN classificationLebanonLesothoLiberiaLibyaLithuaniaLow & middle incomeLow incomeLower middle incomeLuxembourgMacao SAR, ChinaMacedonia, FYRMadagascarMalawiMalaysiaMaldivesMaliMaltaMauritaniaMauritiusMexicoMiddle East & North AfricaMiddle East & North Africa (excluding high income)Middle East & North Africa (IDA & IBRD countries)Middle incomeMoldovaMongoliaMontenegroMoroccoMozambiqueNamibiaNepalNetherlandsNew ZealandNicaraguaNigerNigeriaNorth AmericaNorwayOECD membersOmanOther small statesPacific island small statesPakistanPanamaPapua New GuineaParaguayPeruPhilippinesPolandPortugalPost-demographic dividendPre-demographic dividendQatarRomaniaRussian FederationRwandaSaudi ArabiaSenegalSerbiaSeychellesSierra LeoneSingaporeSlovak RepublicSloveniaSmall statesSolomon IslandsSouth AfricaSouth AsiaSouth Asia (IDA & IBRD)SpainSri LankaSt. Kitts and NevisSt. LuciaSt. Vincent and the GrenadinesSub-Saharan Africa Sub-Saharan Africa (excluding high income)Sub-Saharan Africa (IDA & IBRD countries)SudanSurinameSwazilandSwedenSwitzerlandSyrian Arab RepublicTajikistanTanzaniaThailandTimor-LesteTogoTongaTrinidad and TobagoTunisiaTurkeyTurkmenistanUgandaUkraineUnited KingdomUnited StatesUpper middle incomeUruguayVanuatuVenezuela, RBVietnamWest Bank and GazaWorldYemen, Rep.ZambiaZimbabwe Linha do tempo:
Nesta escala de tempo está apresentado um gráfico de 1978 ano até 2014 ano Grenada. Dados de 1977 ano ausente. O número de observações reais por data: 31.
Fonte (nome):
Indicadores de desenvolvimento mundial
Fonte (organização):
World Bank staff estimates based on sources and methods in World Bank's "The Changing Wealth of Nations: Measuring Sustainable Development in the New Millennium" (2011).
Categorias:
Economy & Growth, Environment
Foi atualizado:
23 abr 2017 ano
Indicadores de alterações dos valores ao longo dos anos
Mínimo:
-23.616
1 jan 2013 ano
Máximo:
19.48
1 jan 1980 ano
Na data de observação
Valor
Mudança absoluta
A alteração em relação ao valor anterior
1 jan 1978 ano
11.86
+11.86
0.0%
1 jan 1979 ano
10.817
-1.043
-8.8%
1 jan 1980 ano
19.48
+8.663
80.08%
1 jan 1987 ano
12.378
-7.102
-36.46%
1 jan 1988 ano
10.538
-1.84
-14.86%
1 jan 1989 ano
11.939
+1.401
13.3%
1 jan 1990 ano
11.072
-0.867
-7.26%
1 jan 1991 ano
10.784
-0.289
-2.61%
1 jan 1992 ano
10.684
-0.099
-0.92%
1 jan 1993 ano
6.982
-3.702
-34.65%
1 jan 1994 ano
4.012
-2.971
-42.54%
1 jan 1995 ano
15.054
+11.042
275.25%
1 jan 1996 ano
12.974
-2.079
-13.81%
1 jan 1997 ano
6.238
-6.736
-51.92%
1 jan 1998 ano
2.739
-3.499
-56.1%
1 jan 1999 ano
-0.933
-3.672
-134.07%
1 jan 2000 ano
15.012
+15.945
-1.71 mil%
1 jan 2001 ano
10.429
-4.582
-30.53%
1 jan 2002 ano
-2.479
-12.908
-123.77%
1 jan 2003 ano
-9.356
-6.877
277.37%
1 jan 2004 ano
-2.296
+7.06
-75.46%
1 jan 2005 ano
12.188
+14.485
-630.83%
1 jan 2006 ano
7.007
-5.182
-42.52%
1 jan 2007 ano
-10.542
-17.549
-250.46%
1 jan 2008 ano
-9.962
+0.58
-5.5%
1 jan 2009 ano
-13.604
-3.642
36.56%
1 jan 2010 ano
-18.129
-4.524
33.26%
1 jan 2011 ano
-20.275
-2.146
11.84%
1 jan 2012 ano
-22.006
-1.731
8.54%
1 jan 2013 ano
-23.616
-1.61
7.32%
1 jan 2014 ano
-22.225
+1.391
-5.89%
Classificação de países por estatísticas atuais por anos


Comentários: