29
/pt/
pt
AIzaSyAYiBZKx7MnpbEhh9jyipgxe19OcubqV5w
April 1, 2024
50617
Middle income
MIC
false
2
1
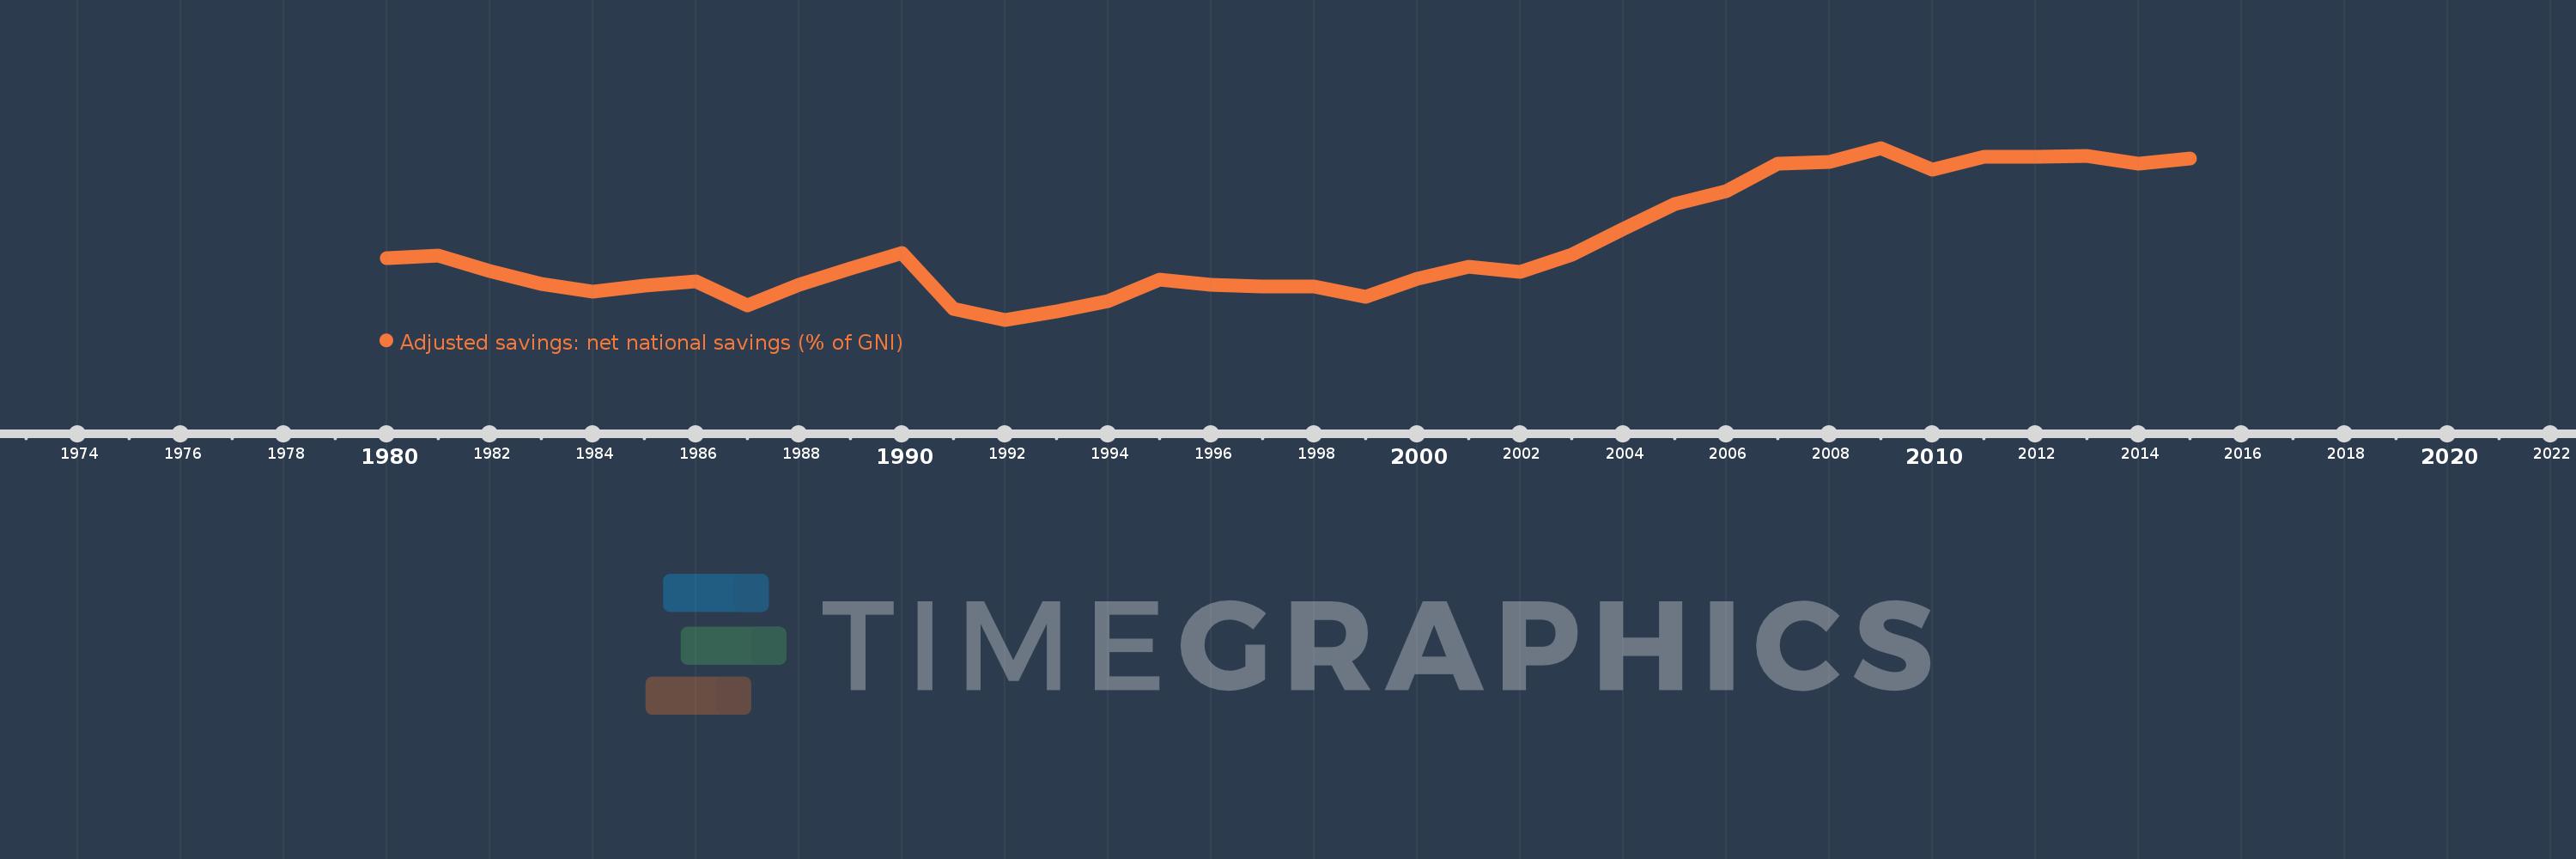
Adjusted savings: net national savings (% of GNI)
2015,2014,2013,2012,2011,2010,2009,2008,2007,2006,2005,2004,2003,2002,2001,2000,1999,1998,1997,1996,1995,1994,1993,1992,1991,1990,1989,1988,1987,1986,1985,1984,1983,1982,1981,1980
Estas estatísticas em outros países:
AfghanistanAlbaniaAlgeriaAngolaAntigua and BarbudaArab WorldArgentinaArmeniaAustraliaAustriaAzerbaijanBahamas, TheBahrainBangladeshBarbadosBelarusBelgiumBelizeBeninBermudaBhutanBoliviaBosnia and HerzegovinaBotswanaBrazilBrunei DarussalamBulgariaBurkina FasoBurundiCabo VerdeCambodiaCameroonCanadaCaribbean small statesCentral African RepublicCentral Europe and the BalticsChadChileChinaColombiaComorosCongo, Dem. Rep.Congo, Rep.Costa RicaCote d'IvoireCroatiaCyprusCzech RepublicDenmarkDjiboutiDominicaDominican RepublicEarly-demographic dividendEast Asia & PacificEast Asia & Pacific (excluding high income)East Asia & Pacific (IDA & IBRD countries)EcuadorEgypt, Arab Rep.El SalvadorEquatorial GuineaEritreaEstoniaEthiopiaEuro areaEurope & Central AsiaEurope & Central Asia (excluding high income)Europe & Central Asia (IDA & IBRD countries)European UnionFijiFinlandFragile and conflict affected situationsFranceGabonGambia, TheGeorgiaGermanyGhanaGreeceGrenadaGuatemalaGuineaGuinea-BissauGuyanaHaitiHeavily indebted poor countries (HIPC)High incomeHondurasHong Kong SAR, ChinaHungaryIBRD onlyIcelandIDA & IBRD totalIDA blendIDA onlyIDA totalIndiaIndonesiaIran, Islamic Rep.IraqIrelandIsraelItalyJamaicaJapanJordanKazakhstanKenyaKiribatiKorea, Rep.KosovoKuwaitKyrgyz RepublicLao PDRLate-demographic dividendLatin America & Caribbean Latin America & Caribbean (excluding high income)Latin America & the Caribbean (IDA & IBRD countries)LatviaLeast developed countries: UN classificationLebanonLesothoLiberiaLibyaLithuaniaLow & middle incomeLow incomeLower middle incomeLuxembourgMacao SAR, ChinaMacedonia, FYRMadagascarMalawiMalaysiaMaldivesMaliMaltaMauritaniaMauritiusMexicoMiddle East & North AfricaMiddle East & North Africa (excluding high income)Middle East & North Africa (IDA & IBRD countries)Middle incomeMoldovaMongoliaMontenegroMoroccoMozambiqueNamibiaNepalNetherlandsNew ZealandNicaraguaNigerNigeriaNorth AmericaNorwayOECD membersOmanOther small statesPacific island small statesPakistanPanamaPapua New GuineaParaguayPeruPhilippinesPolandPortugalPost-demographic dividendPre-demographic dividendQatarRomaniaRussian FederationRwandaSaudi ArabiaSenegalSerbiaSeychellesSierra LeoneSingaporeSlovak RepublicSloveniaSmall statesSolomon IslandsSouth AfricaSouth AsiaSouth Asia (IDA & IBRD)SpainSri LankaSt. Kitts and NevisSt. LuciaSt. Vincent and the GrenadinesSub-Saharan Africa Sub-Saharan Africa (excluding high income)Sub-Saharan Africa (IDA & IBRD countries)SudanSurinameSwazilandSwedenSwitzerlandSyrian Arab RepublicTajikistanTanzaniaThailandTimor-LesteTogoTongaTrinidad and TobagoTunisiaTurkeyTurkmenistanUgandaUkraineUnited KingdomUnited StatesUpper middle incomeUruguayVanuatuVenezuela, RBVietnamWest Bank and GazaWorldYemen, Rep.ZambiaZimbabwe Linha do tempo:
Nesta escala de tempo está apresentado um gráfico de 1980 ano até 2015 ano Middle income. Dados de 1979 ano ausente. O número de observações reais por data: 36.
Fonte (nome):
Indicadores de desenvolvimento mundial
Fonte (organização):
World Bank staff estimates based on sources and methods in World Bank's "The Changing Wealth of Nations: Measuring Sustainable Development in the New Millennium" (2011).
Categorias:
Economy & Growth, Environment
Foi atualizado:
23 abr 2017 ano
Indicadores de alterações dos valores ao longo dos anos
Mínimo:
10.496
1 jan 1992 ano
Máximo:
24.133
1 jan 2009 ano
Na data de observação
Valor
Mudança absoluta
A alteração em relação ao valor anterior
1 jan 1980 ano
15.402
+15.402
0.0%
1 jan 1981 ano
15.611
+0.209
1.35%
1 jan 1982 ano
14.343
-1.268
-8.12%
1 jan 1983 ano
13.324
-1.019
-7.1%
1 jan 1984 ano
12.693
-0.631
-4.73%
1 jan 1985 ano
13.186
+0.492
3.88%
1 jan 1986 ano
13.565
+0.379
2.87%
1 jan 1987 ano
11.622
-1.942
-14.32%
1 jan 1988 ano
13.29
+1.668
14.35%
1 jan 1989 ano
14.569
+1.279
9.63%
1 jan 1990 ano
15.827
+1.257
8.63%
1 jan 1991 ano
11.339
-4.487
-28.35%
1 jan 1992 ano
10.496
-0.843
-7.43%
1 jan 1993 ano
11.181
+0.685
6.52%
1 jan 1994 ano
11.98
+0.799
7.14%
1 jan 1995 ano
13.684
+1.705
14.23%
1 jan 1996 ano
13.247
-0.437
-3.2%
1 jan 1997 ano
13.153
-0.094
-0.71%
1 jan 1998 ano
13.122
-0.031
-0.24%
1 jan 1999 ano
12.284
-0.838
-6.39%
1 jan 2000 ano
13.725
+1.441
11.73%
1 jan 2001 ano
14.696
+0.971
7.07%
1 jan 2002 ano
14.326
-0.369
-2.51%
1 jan 2003 ano
15.645
+1.318
9.2%
1 jan 2004 ano
17.695
+2.051
13.11%
1 jan 2005 ano
19.651
+1.956
11.05%
1 jan 2006 ano
20.702
+1.051
5.35%
1 jan 2007 ano
22.894
+2.191
10.58%
1 jan 2008 ano
23.05
+0.156
0.68%
1 jan 2009 ano
24.133
+1.083
4.7%
1 jan 2010 ano
22.385
-1.748
-7.24%
1 jan 2011 ano
23.451
+1.066
4.76%
1 jan 2012 ano
23.416
-0.035
-0.15%
1 jan 2013 ano
23.513
+0.097
0.42%
1 jan 2014 ano
22.852
-0.662
-2.81%
1 jan 2015 ano
23.289
+0.437
1.91%
Classificação de países por estatísticas atuais por anos


Comentários: