29
/pt/
pt
AIzaSyAYiBZKx7MnpbEhh9jyipgxe19OcubqV5w
April 1, 2024
116598
Cyprus
CYP
true
2
1
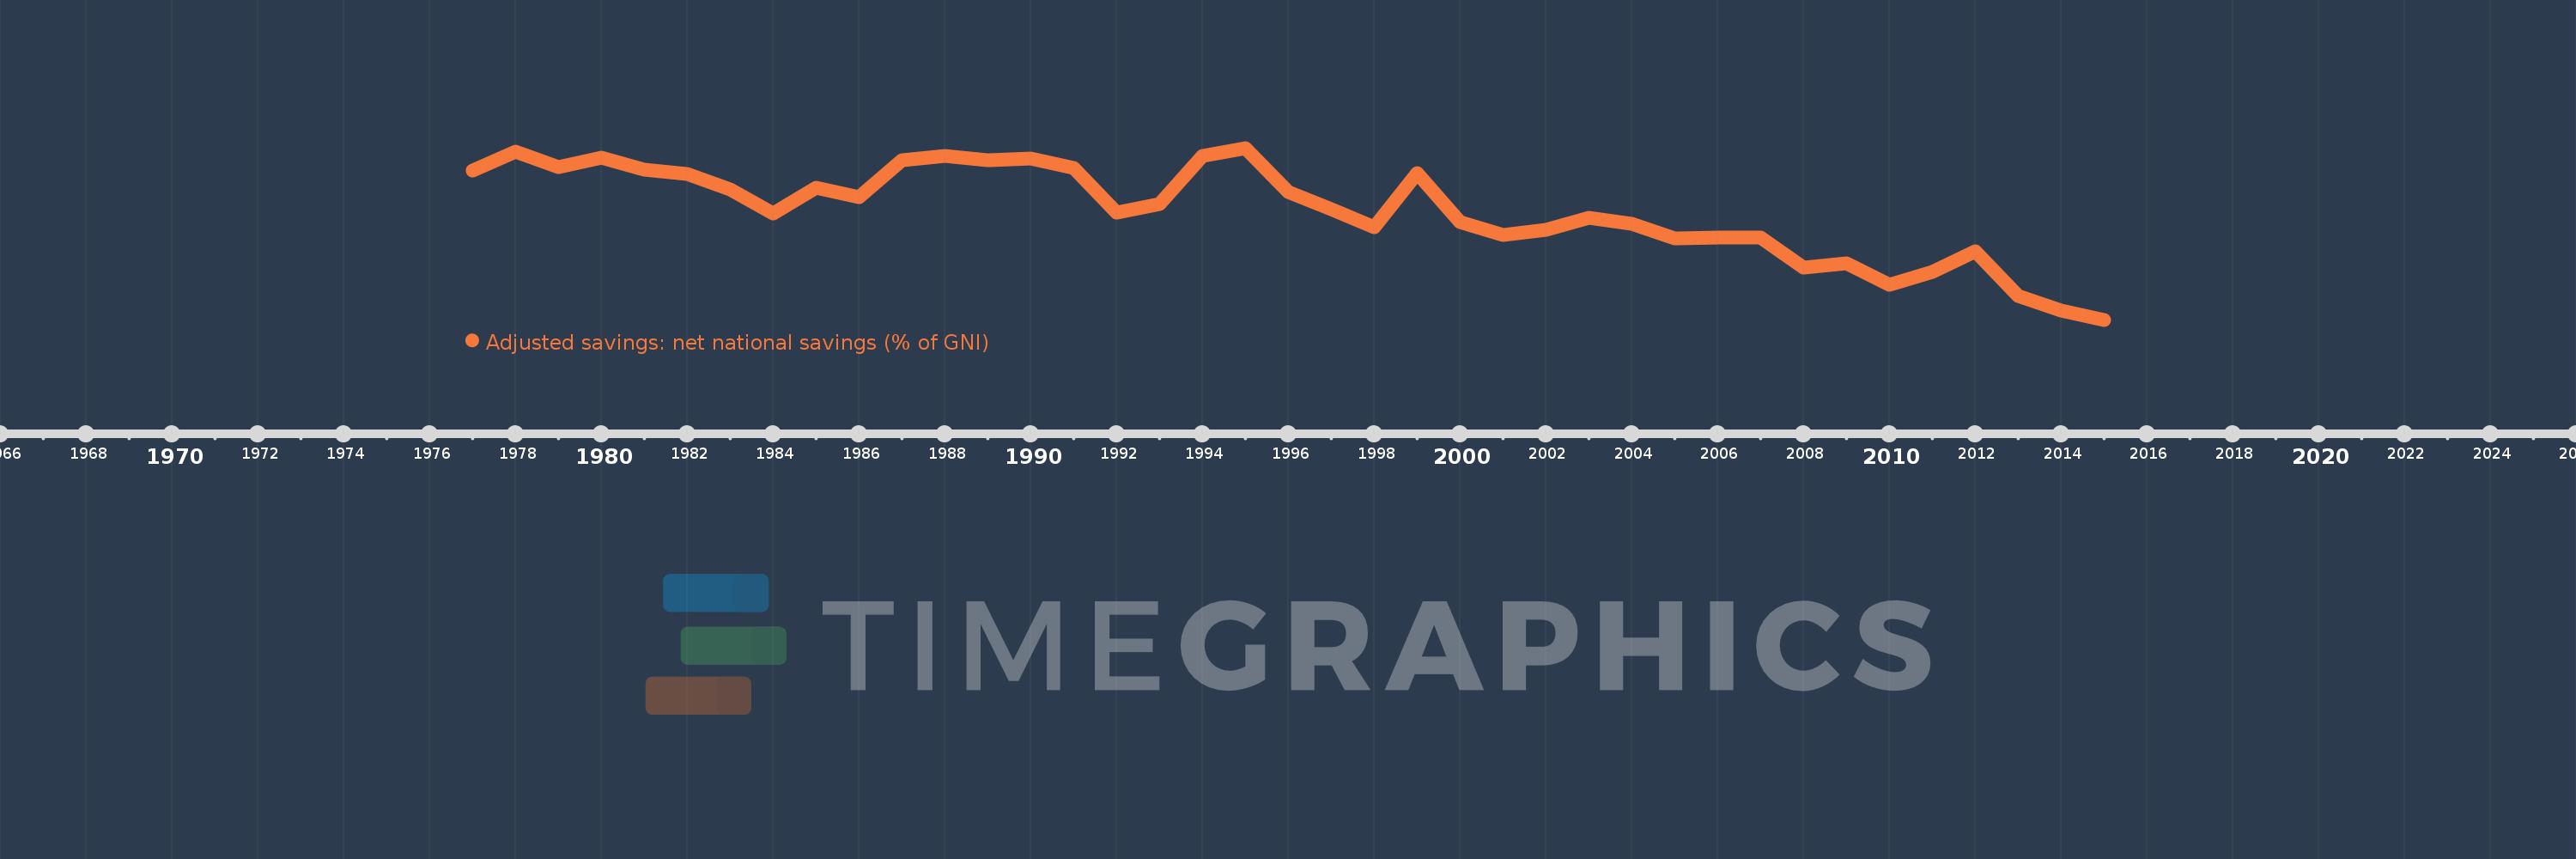
Adjusted savings: net national savings (% of GNI)
2015,2014,2013,2012,2011,2010,2009,2008,2007,2006,2005,2004,2003,2002,2001,2000,1999,1998,1997,1996,1995,1994,1993,1992,1991,1990,1989,1988,1987,1986,1985,1984,1983,1982,1981,1980,1979,1978,1977
Estas estatísticas em outros países:
AfghanistanAlbaniaAlgeriaAngolaAntigua and BarbudaArab WorldArgentinaArmeniaAustraliaAustriaAzerbaijanBahamas, TheBahrainBangladeshBarbadosBelarusBelgiumBelizeBeninBermudaBhutanBoliviaBosnia and HerzegovinaBotswanaBrazilBrunei DarussalamBulgariaBurkina FasoBurundiCabo VerdeCambodiaCameroonCanadaCaribbean small statesCentral African RepublicCentral Europe and the BalticsChadChileChinaColombiaComorosCongo, Dem. Rep.Congo, Rep.Costa RicaCote d'IvoireCroatiaCyprusCzech RepublicDenmarkDjiboutiDominicaDominican RepublicEarly-demographic dividendEast Asia & PacificEast Asia & Pacific (excluding high income)East Asia & Pacific (IDA & IBRD countries)EcuadorEgypt, Arab Rep.El SalvadorEquatorial GuineaEritreaEstoniaEthiopiaEuro areaEurope & Central AsiaEurope & Central Asia (excluding high income)Europe & Central Asia (IDA & IBRD countries)European UnionFijiFinlandFragile and conflict affected situationsFranceGabonGambia, TheGeorgiaGermanyGhanaGreeceGrenadaGuatemalaGuineaGuinea-BissauGuyanaHaitiHeavily indebted poor countries (HIPC)High incomeHondurasHong Kong SAR, ChinaHungaryIBRD onlyIcelandIDA & IBRD totalIDA blendIDA onlyIDA totalIndiaIndonesiaIran, Islamic Rep.IraqIrelandIsraelItalyJamaicaJapanJordanKazakhstanKenyaKiribatiKorea, Rep.KosovoKuwaitKyrgyz RepublicLao PDRLate-demographic dividendLatin America & Caribbean Latin America & Caribbean (excluding high income)Latin America & the Caribbean (IDA & IBRD countries)LatviaLeast developed countries: UN classificationLebanonLesothoLiberiaLibyaLithuaniaLow & middle incomeLow incomeLower middle incomeLuxembourgMacao SAR, ChinaMacedonia, FYRMadagascarMalawiMalaysiaMaldivesMaliMaltaMauritaniaMauritiusMexicoMiddle East & North AfricaMiddle East & North Africa (excluding high income)Middle East & North Africa (IDA & IBRD countries)Middle incomeMoldovaMongoliaMontenegroMoroccoMozambiqueNamibiaNepalNetherlandsNew ZealandNicaraguaNigerNigeriaNorth AmericaNorwayOECD membersOmanOther small statesPacific island small statesPakistanPanamaPapua New GuineaParaguayPeruPhilippinesPolandPortugalPost-demographic dividendPre-demographic dividendQatarRomaniaRussian FederationRwandaSaudi ArabiaSenegalSerbiaSeychellesSierra LeoneSingaporeSlovak RepublicSloveniaSmall statesSolomon IslandsSouth AfricaSouth AsiaSouth Asia (IDA & IBRD)SpainSri LankaSt. Kitts and NevisSt. LuciaSt. Vincent and the GrenadinesSub-Saharan Africa Sub-Saharan Africa (excluding high income)Sub-Saharan Africa (IDA & IBRD countries)SudanSurinameSwazilandSwedenSwitzerlandSyrian Arab RepublicTajikistanTanzaniaThailandTimor-LesteTogoTongaTrinidad and TobagoTunisiaTurkeyTurkmenistanUgandaUkraineUnited KingdomUnited StatesUpper middle incomeUruguayVanuatuVenezuela, RBVietnamWest Bank and GazaWorldYemen, Rep.ZambiaZimbabwe Linha do tempo:
Nesta escala de tempo está apresentado um gráfico de 1977 ano até 2015 ano Cyprus. Dados de 1976 ano ausente. O número de observações reais por data: 39.
Fonte (nome):
Indicadores de desenvolvimento mundial
Fonte (organização):
World Bank staff estimates based on sources and methods in World Bank's "The Changing Wealth of Nations: Measuring Sustainable Development in the New Millennium" (2011).
Categorias:
Economy & Growth, Environment
Foi atualizado:
23 abr 2017 ano
Indicadores de alterações dos valores ao longo dos anos
Mínimo:
-5.186
1 jan 2015 ano
Máximo:
17.089
1 jan 1995 ano
Na data de observação
Valor
Mudança absoluta
A alteração em relação ao valor anterior
1 jan 1977 ano
14.17
+14.17
0.0%
1 jan 1978 ano
16.641
+2.471
17.44%
1 jan 1979 ano
14.567
-2.074
-12.46%
1 jan 1980 ano
15.868
+1.301
8.93%
1 jan 1981 ano
14.27
-1.598
-10.07%
1 jan 1982 ano
13.693
-0.577
-4.04%
1 jan 1983 ano
11.678
-2.015
-14.72%
1 jan 1984 ano
8.634
-3.043
-26.06%
1 jan 1985 ano
11.986
+3.351
38.82%
1 jan 1986 ano
10.708
-1.277
-10.66%
1 jan 1987 ano
15.453
+4.745
44.31%
1 jan 1988 ano
16.042
+0.588
3.81%
1 jan 1989 ano
15.5
-0.541
-3.38%
1 jan 1990 ano
15.748
+0.248
1.6%
1 jan 1991 ano
14.506
-1.242
-7.89%
1 jan 1992 ano
8.652
-5.854
-40.35%
1 jan 1993 ano
9.806
+1.154
13.34%
1 jan 1994 ano
16.017
+6.211
63.34%
1 jan 1995 ano
17.089
+1.072
6.69%
1 jan 1996 ano
11.405
-5.684
-33.26%
1 jan 1997 ano
9.142
-2.263
-19.84%
1 jan 1998 ano
6.784
-2.358
-25.79%
1 jan 1999 ano
13.837
+7.053
103.96%
1 jan 2000 ano
7.491
-6.345
-45.86%
1 jan 2001 ano
5.784
-1.708
-22.8%
1 jan 2002 ano
6.439
+0.656
11.34%
1 jan 2003 ano
7.993
+1.554
24.13%
1 jan 2004 ano
7.221
-0.772
-9.66%
1 jan 2005 ano
5.397
-1.824
-25.26%
1 jan 2006 ano
5.48
+0.083
1.54%
1 jan 2007 ano
5.465
-0.015
-0.27%
1 jan 2008 ano
1.533
-3.933
-71.95%
1 jan 2009 ano
2.166
+0.633
41.31%
1 jan 2010 ano
-0.609
-2.775
-128.14%
1 jan 2011 ano
1.013
+1.623
-266.27%
1 jan 2012 ano
3.648
+2.635
260.01%
1 jan 2013 ano
-2.115
-5.763
-157.99%
1 jan 2014 ano
-3.956
-1.841
87.02%
1 jan 2015 ano
-5.186
-1.23
31.09%
Classificação de países por estatísticas atuais por anos


Comentários: