29
/pt/
pt
AIzaSyAYiBZKx7MnpbEhh9jyipgxe19OcubqV5w
April 1, 2024
111830
Costa Rica
CRI
true
2
1
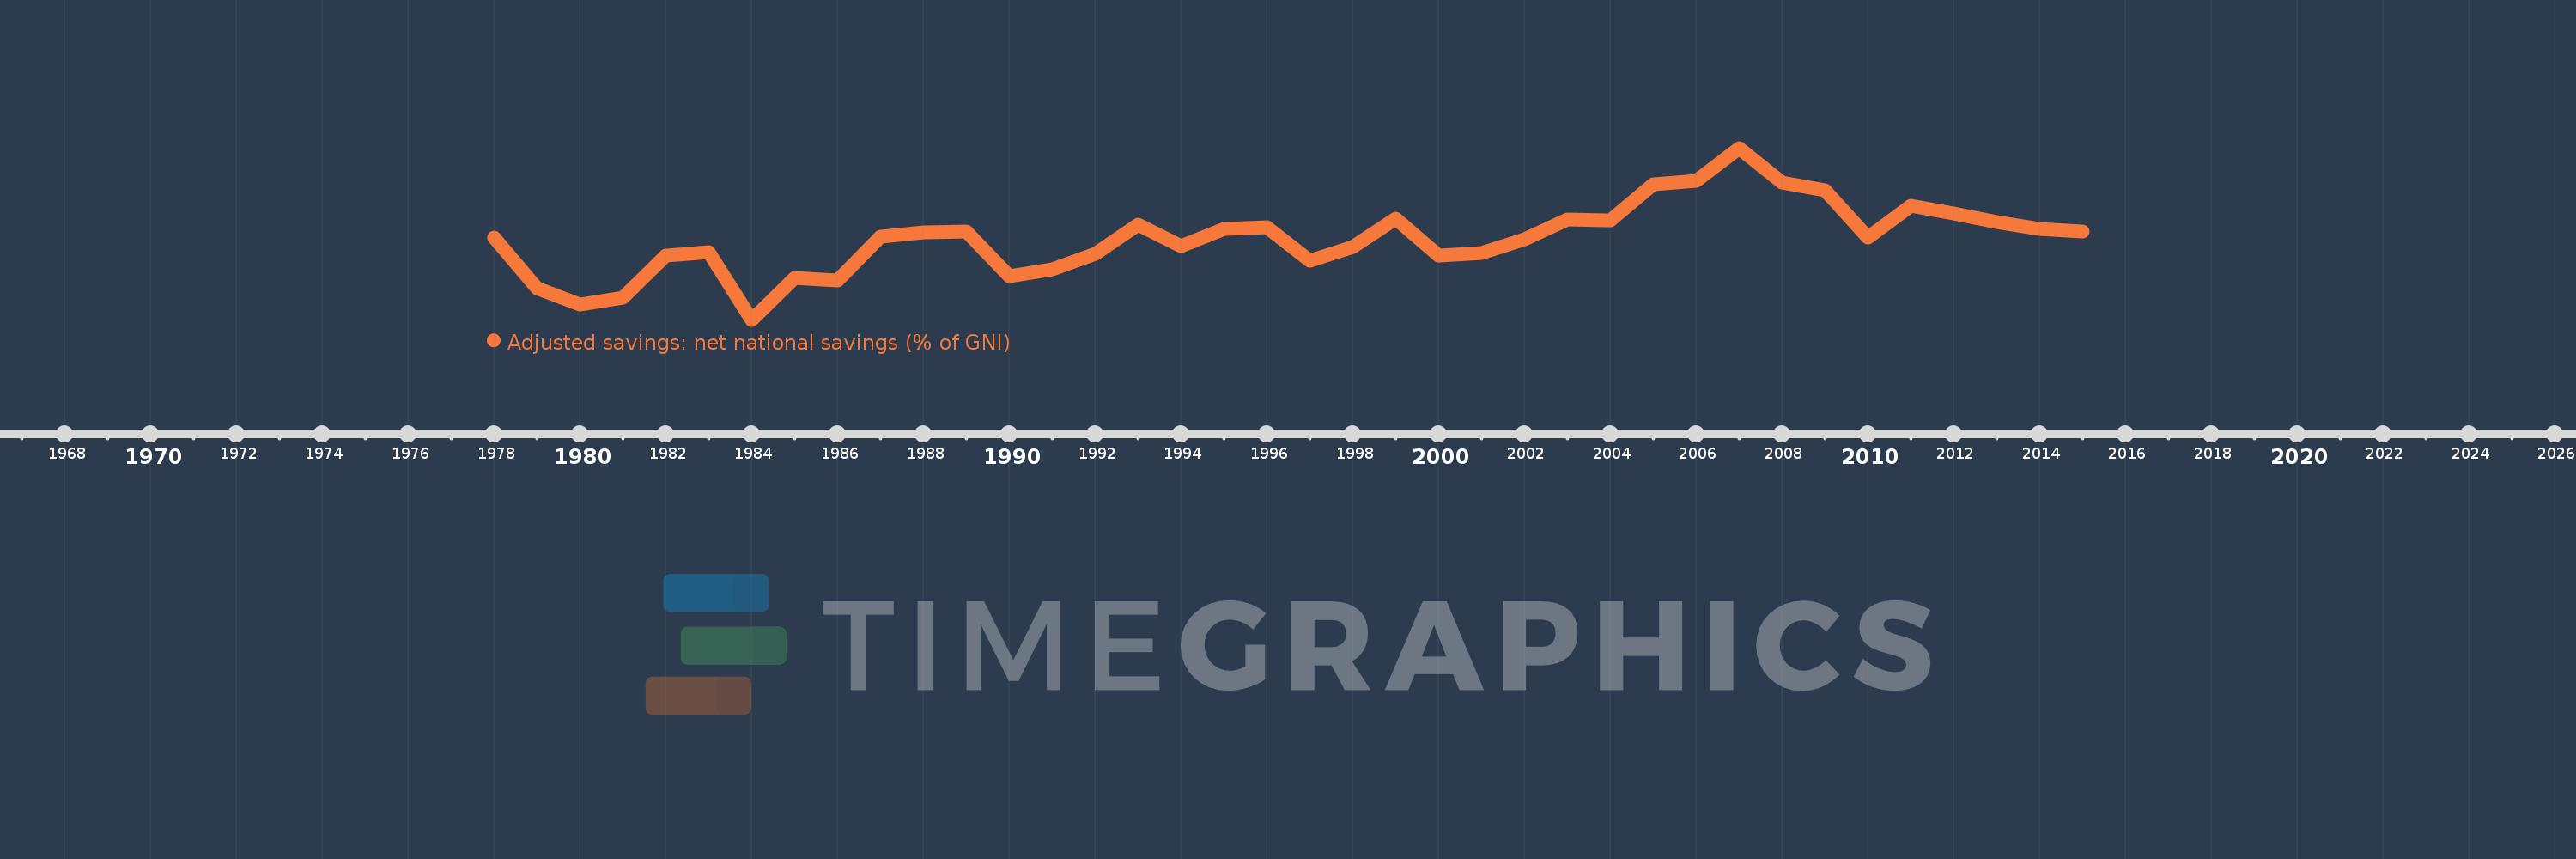
Adjusted savings: net national savings (% of GNI)
2015,2014,2013,2012,2011,2010,2009,2008,2007,2006,2005,2004,2003,2002,2001,2000,1999,1998,1997,1996,1995,1994,1993,1992,1991,1990,1989,1988,1987,1986,1985,1984,1983,1982,1981,1980,1979,1978
Estas estatísticas em outros países:
AfghanistanAlbaniaAlgeriaAngolaAntigua and BarbudaArab WorldArgentinaArmeniaAustraliaAustriaAzerbaijanBahamas, TheBahrainBangladeshBarbadosBelarusBelgiumBelizeBeninBermudaBhutanBoliviaBosnia and HerzegovinaBotswanaBrazilBrunei DarussalamBulgariaBurkina FasoBurundiCabo VerdeCambodiaCameroonCanadaCaribbean small statesCentral African RepublicCentral Europe and the BalticsChadChileChinaColombiaComorosCongo, Dem. Rep.Congo, Rep.Costa RicaCote d'IvoireCroatiaCyprusCzech RepublicDenmarkDjiboutiDominicaDominican RepublicEarly-demographic dividendEast Asia & PacificEast Asia & Pacific (excluding high income)East Asia & Pacific (IDA & IBRD countries)EcuadorEgypt, Arab Rep.El SalvadorEquatorial GuineaEritreaEstoniaEthiopiaEuro areaEurope & Central AsiaEurope & Central Asia (excluding high income)Europe & Central Asia (IDA & IBRD countries)European UnionFijiFinlandFragile and conflict affected situationsFranceGabonGambia, TheGeorgiaGermanyGhanaGreeceGrenadaGuatemalaGuineaGuinea-BissauGuyanaHaitiHeavily indebted poor countries (HIPC)High incomeHondurasHong Kong SAR, ChinaHungaryIBRD onlyIcelandIDA & IBRD totalIDA blendIDA onlyIDA totalIndiaIndonesiaIran, Islamic Rep.IraqIrelandIsraelItalyJamaicaJapanJordanKazakhstanKenyaKiribatiKorea, Rep.KosovoKuwaitKyrgyz RepublicLao PDRLate-demographic dividendLatin America & Caribbean Latin America & Caribbean (excluding high income)Latin America & the Caribbean (IDA & IBRD countries)LatviaLeast developed countries: UN classificationLebanonLesothoLiberiaLibyaLithuaniaLow & middle incomeLow incomeLower middle incomeLuxembourgMacao SAR, ChinaMacedonia, FYRMadagascarMalawiMalaysiaMaldivesMaliMaltaMauritaniaMauritiusMexicoMiddle East & North AfricaMiddle East & North Africa (excluding high income)Middle East & North Africa (IDA & IBRD countries)Middle incomeMoldovaMongoliaMontenegroMoroccoMozambiqueNamibiaNepalNetherlandsNew ZealandNicaraguaNigerNigeriaNorth AmericaNorwayOECD membersOmanOther small statesPacific island small statesPakistanPanamaPapua New GuineaParaguayPeruPhilippinesPolandPortugalPost-demographic dividendPre-demographic dividendQatarRomaniaRussian FederationRwandaSaudi ArabiaSenegalSerbiaSeychellesSierra LeoneSingaporeSlovak RepublicSloveniaSmall statesSolomon IslandsSouth AfricaSouth AsiaSouth Asia (IDA & IBRD)SpainSri LankaSt. Kitts and NevisSt. LuciaSt. Vincent and the GrenadinesSub-Saharan Africa Sub-Saharan Africa (excluding high income)Sub-Saharan Africa (IDA & IBRD countries)SudanSurinameSwazilandSwedenSwitzerlandSyrian Arab RepublicTajikistanTanzaniaThailandTimor-LesteTogoTongaTrinidad and TobagoTunisiaTurkeyTurkmenistanUgandaUkraineUnited KingdomUnited StatesUpper middle incomeUruguayVanuatuVenezuela, RBVietnamWest Bank and GazaWorldYemen, Rep.ZambiaZimbabwe Linha do tempo:
Nesta escala de tempo está apresentado um gráfico de 1978 ano até 2015 ano Costa Rica. Dados de 1977 ano ausente. O número de observações reais por data: 38.
Fonte (nome):
Indicadores de desenvolvimento mundial
Fonte (organização):
World Bank staff estimates based on sources and methods in World Bank's "The Changing Wealth of Nations: Measuring Sustainable Development in the New Millennium" (2011).
Categorias:
Economy & Growth, Environment
Foi atualizado:
23 abr 2017 ano
Indicadores de alterações dos valores ao longo dos anos
Mínimo:
1.932
1 jan 1984 ano
Máximo:
15.775
1 jan 2007 ano
Na data de observação
Valor
Mudança absoluta
A alteração em relação ao valor anterior
1 jan 1978 ano
8.551
+8.551
0.0%
1 jan 1979 ano
4.505
-4.046
-47.32%
1 jan 1980 ano
3.155
-1.35
-29.96%
1 jan 1981 ano
3.698
+0.543
17.23%
1 jan 1982 ano
7.083
+3.384
91.51%
1 jan 1983 ano
7.384
+0.302
4.26%
1 jan 1984 ano
1.932
-5.453
-73.84%
1 jan 1985 ano
5.273
+3.341
172.94%
1 jan 1986 ano
5.095
-0.178
-3.38%
1 jan 1987 ano
8.603
+3.508
68.86%
1 jan 1988 ano
8.963
+0.36
4.19%
1 jan 1989 ano
9.049
+0.085
0.95%
1 jan 1990 ano
5.42
-3.629
-40.1%
1 jan 1991 ano
6.014
+0.594
10.96%
1 jan 1992 ano
7.207
+1.193
19.84%
1 jan 1993 ano
9.567
+2.36
32.74%
1 jan 1994 ano
7.879
-1.688
-17.65%
1 jan 1995 ano
9.265
+1.386
17.6%
1 jan 1996 ano
9.367
+0.102
1.1%
1 jan 1997 ano
6.66
-2.707
-28.9%
1 jan 1998 ano
7.778
+1.118
16.79%
1 jan 1999 ano
10.072
+2.293
29.49%
1 jan 2000 ano
7.122
-2.95
-29.29%
1 jan 2001 ano
7.289
+0.168
2.35%
1 jan 2002 ano
8.452
+1.162
15.95%
1 jan 2003 ano
9.992
+1.54
18.23%
1 jan 2004 ano
9.955
-0.037
-0.37%
1 jan 2005 ano
12.833
+2.878
28.9%
1 jan 2006 ano
13.151
+0.318
2.48%
1 jan 2007 ano
15.775
+2.623
19.95%
1 jan 2008 ano
12.953
-2.821
-17.88%
1 jan 2009 ano
12.368
-0.586
-4.52%
1 jan 2010 ano
8.557
-3.81
-30.81%
1 jan 2011 ano
11.112
+2.554
29.85%
1 jan 2012 ano
10.494
-0.618
-5.56%
1 jan 2013 ano
9.799
-0.695
-6.63%
1 jan 2014 ano
9.274
-0.525
-5.36%
1 jan 2015 ano
9.058
-0.216
-2.33%
Classificação de países por estatísticas atuais por anos


Comentários: