29
/pt/
pt
AIzaSyAYiBZKx7MnpbEhh9jyipgxe19OcubqV5w
April 1, 2024
212571
Nigeria
NGA
true
2
1
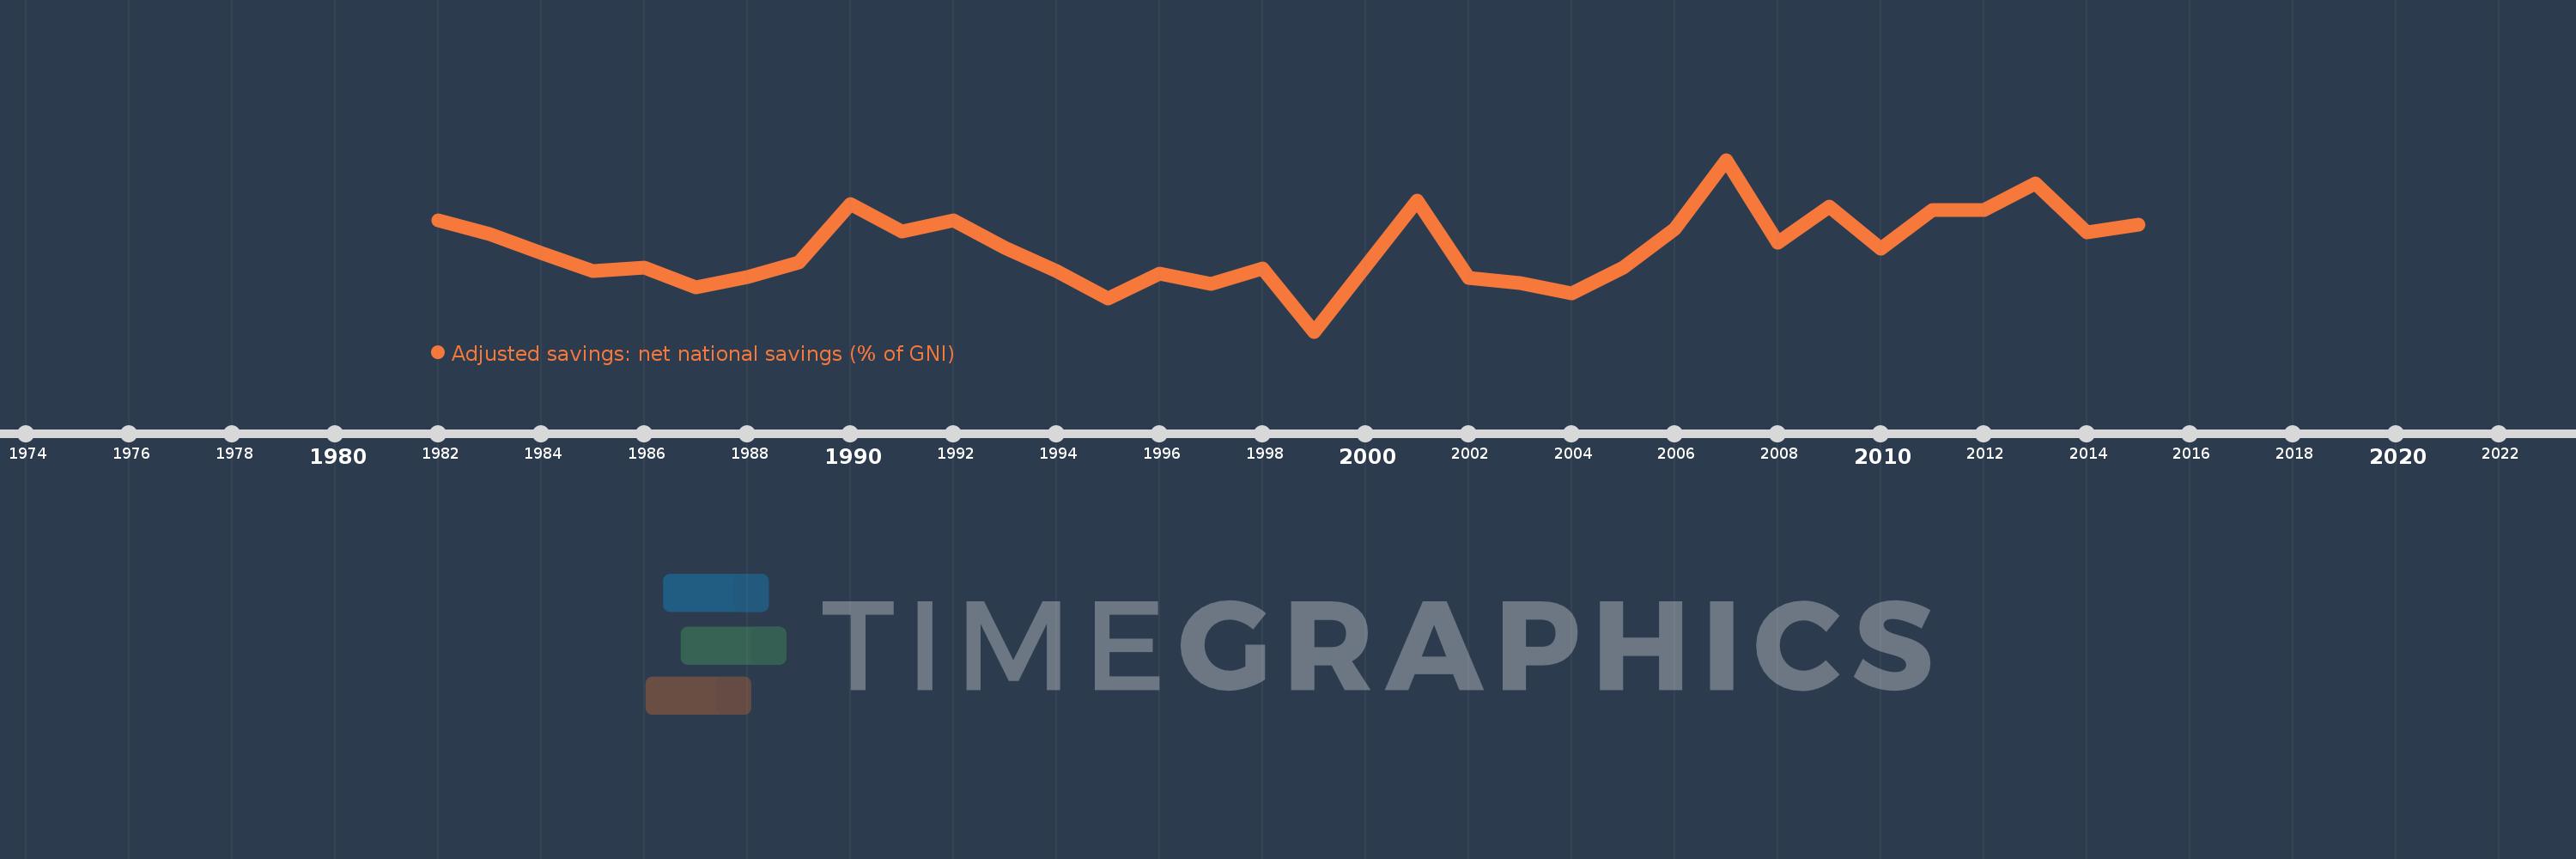
Adjusted savings: net national savings (% of GNI)
2015,2014,2013,2012,2011,2010,2009,2008,2007,2006,2005,2004,2003,2002,2001,1999,1998,1997,1996,1995,1994,1993,1992,1991,1990,1989,1988,1987,1986,1985,1984,1983,1982
Estas estatísticas em outros países:
AfghanistanAlbaniaAlgeriaAngolaAntigua and BarbudaArab WorldArgentinaArmeniaAustraliaAustriaAzerbaijanBahamas, TheBahrainBangladeshBarbadosBelarusBelgiumBelizeBeninBermudaBhutanBoliviaBosnia and HerzegovinaBotswanaBrazilBrunei DarussalamBulgariaBurkina FasoBurundiCabo VerdeCambodiaCameroonCanadaCaribbean small statesCentral African RepublicCentral Europe and the BalticsChadChileChinaColombiaComorosCongo, Dem. Rep.Congo, Rep.Costa RicaCote d'IvoireCroatiaCyprusCzech RepublicDenmarkDjiboutiDominicaDominican RepublicEarly-demographic dividendEast Asia & PacificEast Asia & Pacific (excluding high income)East Asia & Pacific (IDA & IBRD countries)EcuadorEgypt, Arab Rep.El SalvadorEquatorial GuineaEritreaEstoniaEthiopiaEuro areaEurope & Central AsiaEurope & Central Asia (excluding high income)Europe & Central Asia (IDA & IBRD countries)European UnionFijiFinlandFragile and conflict affected situationsFranceGabonGambia, TheGeorgiaGermanyGhanaGreeceGrenadaGuatemalaGuineaGuinea-BissauGuyanaHaitiHeavily indebted poor countries (HIPC)High incomeHondurasHong Kong SAR, ChinaHungaryIBRD onlyIcelandIDA & IBRD totalIDA blendIDA onlyIDA totalIndiaIndonesiaIran, Islamic Rep.IraqIrelandIsraelItalyJamaicaJapanJordanKazakhstanKenyaKiribatiKorea, Rep.KosovoKuwaitKyrgyz RepublicLao PDRLate-demographic dividendLatin America & Caribbean Latin America & Caribbean (excluding high income)Latin America & the Caribbean (IDA & IBRD countries)LatviaLeast developed countries: UN classificationLebanonLesothoLiberiaLibyaLithuaniaLow & middle incomeLow incomeLower middle incomeLuxembourgMacao SAR, ChinaMacedonia, FYRMadagascarMalawiMalaysiaMaldivesMaliMaltaMauritaniaMauritiusMexicoMiddle East & North AfricaMiddle East & North Africa (excluding high income)Middle East & North Africa (IDA & IBRD countries)Middle incomeMoldovaMongoliaMontenegroMoroccoMozambiqueNamibiaNepalNetherlandsNew ZealandNicaraguaNigerNigeriaNorth AmericaNorwayOECD membersOmanOther small statesPacific island small statesPakistanPanamaPapua New GuineaParaguayPeruPhilippinesPolandPortugalPost-demographic dividendPre-demographic dividendQatarRomaniaRussian FederationRwandaSaudi ArabiaSenegalSerbiaSeychellesSierra LeoneSingaporeSlovak RepublicSloveniaSmall statesSolomon IslandsSouth AfricaSouth AsiaSouth Asia (IDA & IBRD)SpainSri LankaSt. Kitts and NevisSt. LuciaSt. Vincent and the GrenadinesSub-Saharan Africa Sub-Saharan Africa (excluding high income)Sub-Saharan Africa (IDA & IBRD countries)SudanSurinameSwazilandSwedenSwitzerlandSyrian Arab RepublicTajikistanTanzaniaThailandTimor-LesteTogoTongaTrinidad and TobagoTunisiaTurkeyTurkmenistanUgandaUkraineUnited KingdomUnited StatesUpper middle incomeUruguayVanuatuVenezuela, RBVietnamWest Bank and GazaWorldYemen, Rep.ZambiaZimbabwe Linha do tempo:
Nesta escala de tempo está apresentado um gráfico de 1982 ano até 2015 ano Nigeria. Dados de 1981 ano ausente. O número de observações reais por data: 33.
Fonte (nome):
Indicadores de desenvolvimento mundial
Fonte (organização):
World Bank staff estimates based on sources and methods in World Bank's "The Changing Wealth of Nations: Measuring Sustainable Development in the New Millennium" (2011).
Categorias:
Economy & Growth, Environment
Foi atualizado:
23 abr 2017 ano
Indicadores de alterações dos valores ao longo dos anos
Mínimo:
-11.48
1 jan 1999 ano
Máximo:
35.985
1 jan 2007 ano
Na data de observação
Valor
Mudança absoluta
A alteração em relação ao valor anterior
1 jan 1982 ano
19.157
+19.157
0.0%
1 jan 1983 ano
15.501
-3.656
-19.08%
1 jan 1984 ano
10.166
-5.336
-34.42%
1 jan 1985 ano
5.244
-4.921
-48.41%
1 jan 1986 ano
6.298
+1.054
20.1%
1 jan 1987 ano
0.8
-5.499
-87.31%
1 jan 1988 ano
3.661
+2.862
357.92%
1 jan 1989 ano
7.667
+4.006
109.42%
1 jan 1990 ano
23.741
+16.073
209.64%
1 jan 1991 ano
16.278
-7.463
-31.43%
1 jan 1992 ano
19.218
+2.939
18.06%
1 jan 1993 ano
11.634
-7.584
-39.46%
1 jan 1994 ano
5.313
-6.321
-54.33%
1 jan 1995 ano
-2.376
-7.689
-144.72%
1 jan 1996 ano
4.551
+6.927
-291.54%
1 jan 1997 ano
1.661
-2.89
-63.5%
1 jan 1998 ano
5.967
+4.306
259.22%
1 jan 1999 ano
-11.48
-17.447
-292.38%
1 jan 2001 ano
24.66
+36.14
-314.82%
1 jan 2002 ano
3.238
-21.422
-86.87%
1 jan 2003 ano
1.899
-1.339
-41.34%
1 jan 2004 ano
-0.832
-2.731
-143.82%
1 jan 2005 ano
6.158
+6.99
-839.89%
1 jan 2006 ano
16.918
+10.76
174.74%
1 jan 2007 ano
35.985
+19.067
112.71%
1 jan 2008 ano
13.062
-22.923
-63.7%
1 jan 2009 ano
22.958
+9.897
75.77%
1 jan 2010 ano
11.371
-11.587
-50.47%
1 jan 2011 ano
22.164
+10.793
94.91%
1 jan 2012 ano
22.215
+0.051
0.23%
1 jan 2013 ano
29.503
+7.287
32.8%
1 jan 2014 ano
15.915
-13.588
-46.06%
1 jan 2015 ano
18.084
+2.17
13.63%
Classificação de países por estatísticas atuais por anos


Comentários: