29
/pt/
pt
AIzaSyAYiBZKx7MnpbEhh9jyipgxe19OcubqV5w
April 1, 2024
34732
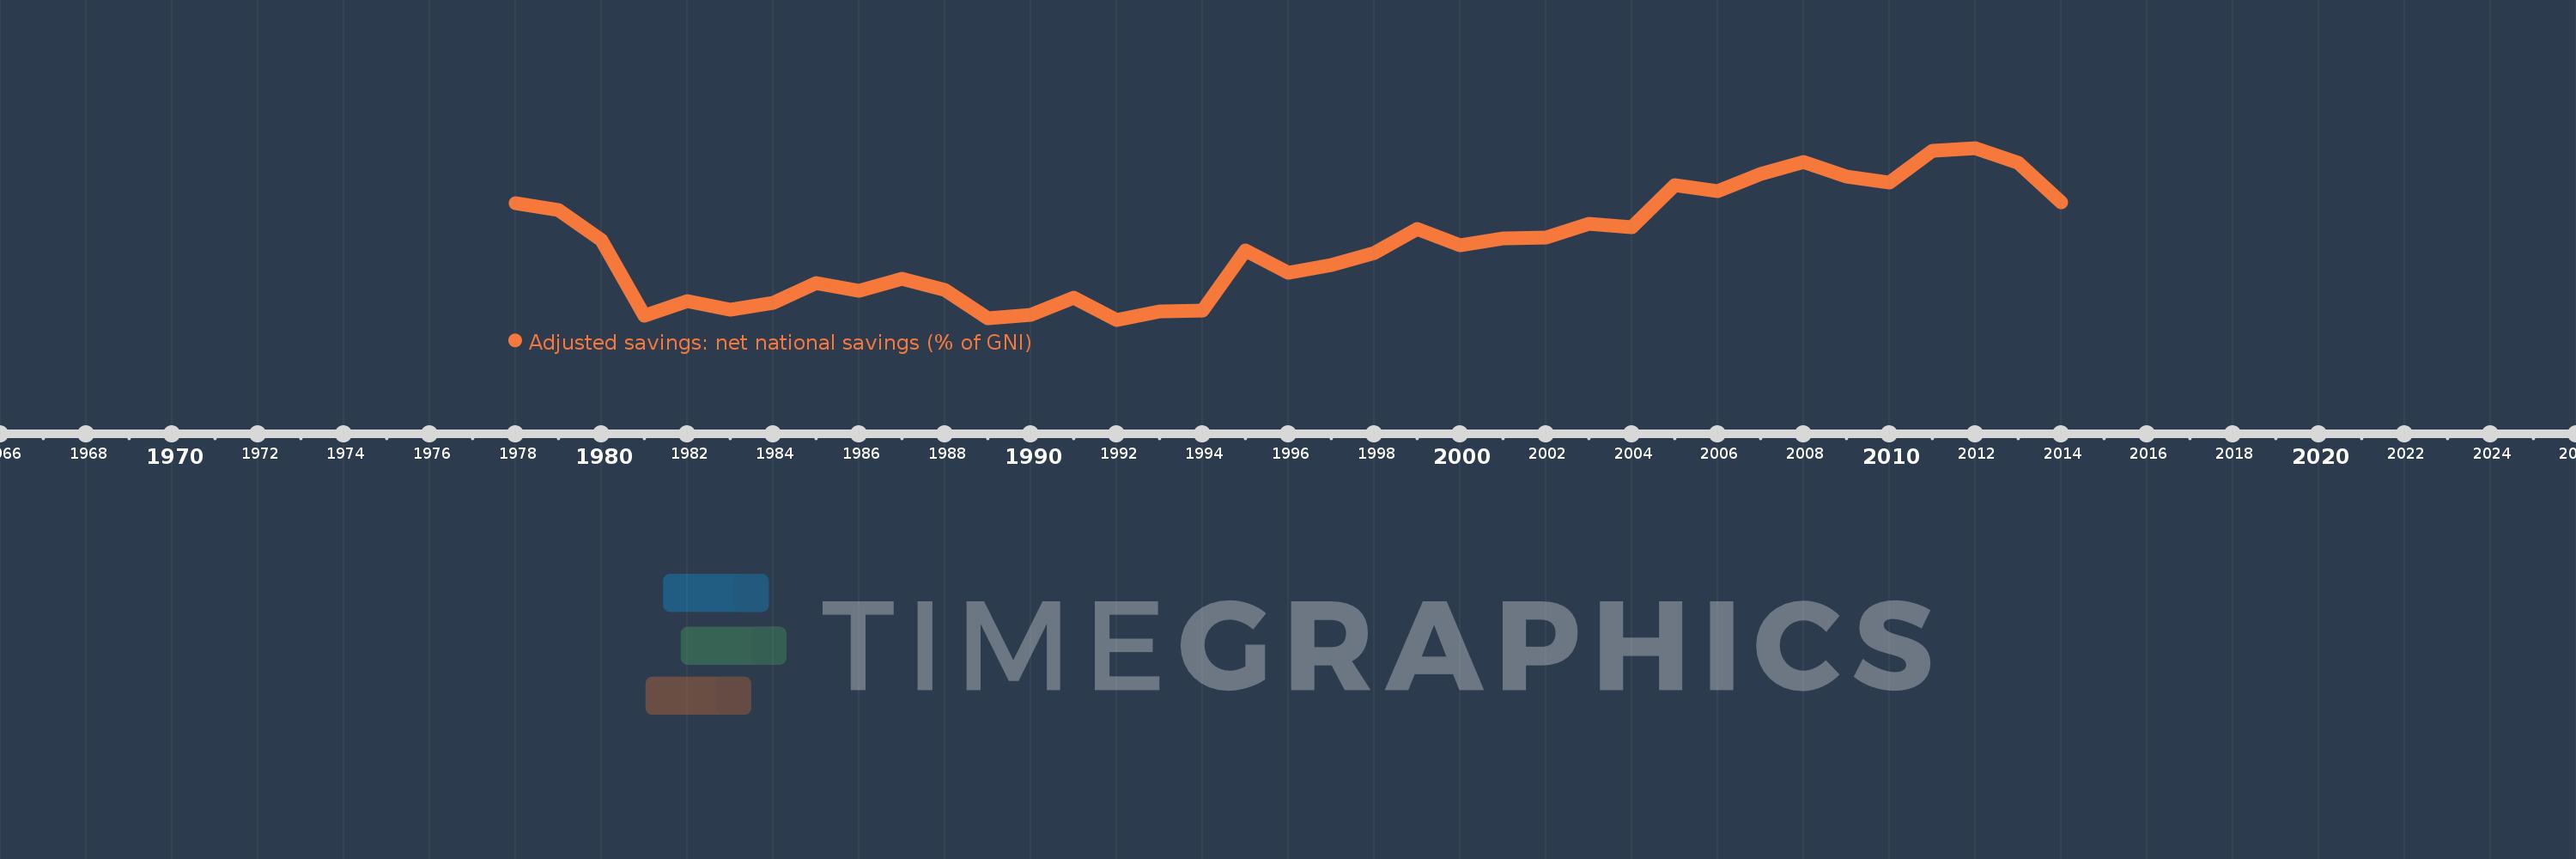
Heavily indebted poor countries (HIPC)
HPC
false
2
1
Adjusted savings: net national savings (% of GNI)
2014,2013,2012,2011,2010,2009,2008,2007,2006,2005,2004,2003,2002,2001,2000,1999,1998,1997,1996,1995,1994,1993,1992,1991,1990,1989,1988,1987,1986,1985,1984,1983,1982,1981,1980,1979,1978
Estas estatísticas em outros países:
AfghanistanAlbaniaAlgeriaAngolaAntigua and BarbudaArab WorldArgentinaArmeniaAustraliaAustriaAzerbaijanBahamas, TheBahrainBangladeshBarbadosBelarusBelgiumBelizeBeninBermudaBhutanBoliviaBosnia and HerzegovinaBotswanaBrazilBrunei DarussalamBulgariaBurkina FasoBurundiCabo VerdeCambodiaCameroonCanadaCaribbean small statesCentral African RepublicCentral Europe and the BalticsChadChileChinaColombiaComorosCongo, Dem. Rep.Congo, Rep.Costa RicaCote d'IvoireCroatiaCyprusCzech RepublicDenmarkDjiboutiDominicaDominican RepublicEarly-demographic dividendEast Asia & PacificEast Asia & Pacific (excluding high income)East Asia & Pacific (IDA & IBRD countries)EcuadorEgypt, Arab Rep.El SalvadorEquatorial GuineaEritreaEstoniaEthiopiaEuro areaEurope & Central AsiaEurope & Central Asia (excluding high income)Europe & Central Asia (IDA & IBRD countries)European UnionFijiFinlandFragile and conflict affected situationsFranceGabonGambia, TheGeorgiaGermanyGhanaGreeceGrenadaGuatemalaGuineaGuinea-BissauGuyanaHaitiHeavily indebted poor countries (HIPC)High incomeHondurasHong Kong SAR, ChinaHungaryIBRD onlyIcelandIDA & IBRD totalIDA blendIDA onlyIDA totalIndiaIndonesiaIran, Islamic Rep.IraqIrelandIsraelItalyJamaicaJapanJordanKazakhstanKenyaKiribatiKorea, Rep.KosovoKuwaitKyrgyz RepublicLao PDRLate-demographic dividendLatin America & Caribbean Latin America & Caribbean (excluding high income)Latin America & the Caribbean (IDA & IBRD countries)LatviaLeast developed countries: UN classificationLebanonLesothoLiberiaLibyaLithuaniaLow & middle incomeLow incomeLower middle incomeLuxembourgMacao SAR, ChinaMacedonia, FYRMadagascarMalawiMalaysiaMaldivesMaliMaltaMauritaniaMauritiusMexicoMiddle East & North AfricaMiddle East & North Africa (excluding high income)Middle East & North Africa (IDA & IBRD countries)Middle incomeMoldovaMongoliaMontenegroMoroccoMozambiqueNamibiaNepalNetherlandsNew ZealandNicaraguaNigerNigeriaNorth AmericaNorwayOECD membersOmanOther small statesPacific island small statesPakistanPanamaPapua New GuineaParaguayPeruPhilippinesPolandPortugalPost-demographic dividendPre-demographic dividendQatarRomaniaRussian FederationRwandaSaudi ArabiaSenegalSerbiaSeychellesSierra LeoneSingaporeSlovak RepublicSloveniaSmall statesSolomon IslandsSouth AfricaSouth AsiaSouth Asia (IDA & IBRD)SpainSri LankaSt. Kitts and NevisSt. LuciaSt. Vincent and the GrenadinesSub-Saharan Africa Sub-Saharan Africa (excluding high income)Sub-Saharan Africa (IDA & IBRD countries)SudanSurinameSwazilandSwedenSwitzerlandSyrian Arab RepublicTajikistanTanzaniaThailandTimor-LesteTogoTongaTrinidad and TobagoTunisiaTurkeyTurkmenistanUgandaUkraineUnited KingdomUnited StatesUpper middle incomeUruguayVanuatuVenezuela, RBVietnamWest Bank and GazaWorldYemen, Rep.ZambiaZimbabwe Linha do tempo:
Nesta escala de tempo está apresentado um gráfico de 1978 ano até 2014 ano Heavily indebted poor countries (HIPC). Dados de 1977 ano ausente. O número de observações reais por data: 37.
Fonte (nome):
Indicadores de desenvolvimento mundial
Fonte (organização):
World Bank staff estimates based on sources and methods in World Bank's "The Changing Wealth of Nations: Measuring Sustainable Development in the New Millennium" (2011).
Categorias:
Economy & Growth, Environment
Foi atualizado:
23 abr 2017 ano
Indicadores de alterações dos valores ao longo dos anos
Mínimo:
-0.31
1 jan 1992 ano
Máximo:
10.812
1 jan 2012 ano
Na data de observação
Valor
Mudança absoluta
A alteração em relação ao valor anterior
1 jan 1978 ano
7.237
+7.237
0.0%
1 jan 1979 ano
6.78
-0.457
-6.31%
1 jan 1980 ano
4.85
-1.93
-28.46%
1 jan 1981 ano
-0.033
-4.883
-100.68%
1 jan 1982 ano
0.914
+0.947
-2.85 mil%
1 jan 1983 ano
0.328
-0.586
-64.08%
1 jan 1984 ano
0.808
+0.48
146.25%
1 jan 1985 ano
2.081
+1.273
157.48%
1 jan 1986 ano
1.555
-0.526
-25.3%
1 jan 1987 ano
2.325
+0.771
49.56%
1 jan 1988 ano
1.64
-0.685
-29.48%
1 jan 1989 ano
-0.194
-1.834
-111.83%
1 jan 1990 ano
0.03
+0.224
-115.45%
1 jan 1991 ano
1.113
+1.083
3.61 mil%
1 jan 1992 ano
-0.31
-1.424
-127.89%
1 jan 1993 ano
0.214
+0.525
-168.96%
1 jan 1994 ano
0.267
+0.053
24.67%
1 jan 1995 ano
4.2
+3.933
1.47 mil%
1 jan 1996 ano
2.707
-1.493
-35.55%
1 jan 1997 ano
3.234
+0.528
19.5%
1 jan 1998 ano
4.001
+0.766
23.69%
1 jan 1999 ano
5.561
+1.56
38.99%
1 jan 2000 ano
4.528
-1.033
-18.57%
1 jan 2001 ano
4.973
+0.445
9.83%
1 jan 2002 ano
5.012
+0.039
0.78%
1 jan 2003 ano
5.913
+0.901
17.98%
1 jan 2004 ano
5.701
-0.212
-3.59%
1 jan 2005 ano
8.377
+2.676
46.95%
1 jan 2006 ano
8.035
-0.342
-4.09%
1 jan 2007 ano
9.104
+1.069
13.3%
1 jan 2008 ano
9.909
+0.805
8.84%
1 jan 2009 ano
8.982
-0.927
-9.35%
1 jan 2010 ano
8.565
-0.417
-4.64%
1 jan 2011 ano
10.63
+2.065
24.11%
1 jan 2012 ano
10.812
+0.181
1.71%
1 jan 2013 ano
9.85
-0.961
-8.89%
1 jan 2014 ano
7.281
-2.569
-26.08%
Classificação de países por estatísticas atuais por anos


Comentários: