29
/pt/
pt
AIzaSyAYiBZKx7MnpbEhh9jyipgxe19OcubqV5w
April 1, 2024
90638
Botswana
BWA
true
2
1
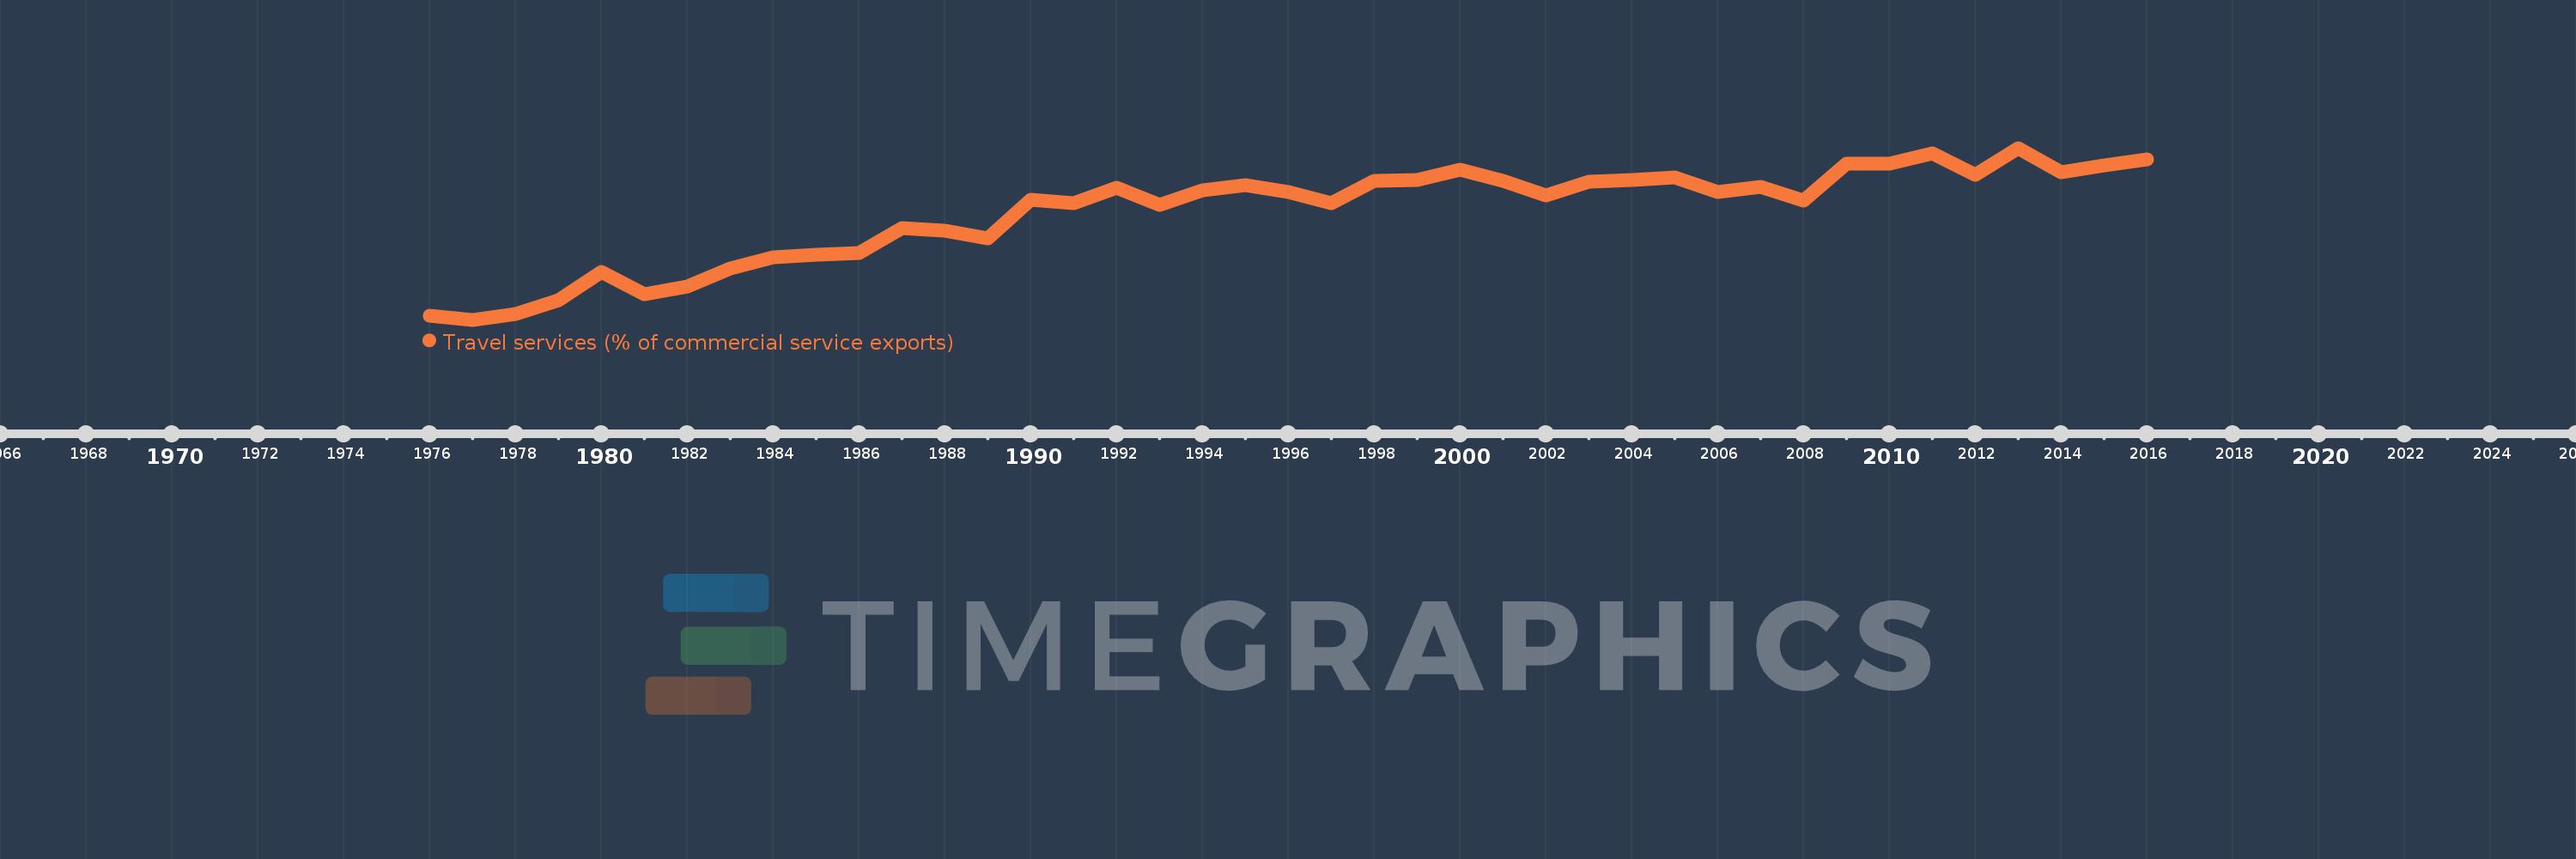
Travel services (% of commercial service exports)
2016,2015,2014,2013,2012,2011,2010,2009,2008,2007,2006,2005,2004,2003,2002,2001,2000,1999,1998,1997,1996,1995,1994,1993,1992,1991,1990,1989,1988,1987,1986,1985,1984,1983,1982,1981,1980,1979,1978,1977,1976
Estas estatísticas em outros países:
AfghanistanAlbaniaAlgeriaAngolaAntigua and BarbudaArab WorldArgentinaArmeniaArubaAustraliaAustriaAzerbaijanBahamas, TheBahrainBangladeshBarbadosBelarusBelgiumBelizeBeninBermudaBhutanBoliviaBosnia and HerzegovinaBotswanaBrazilBrunei DarussalamBulgariaBurkina FasoBurundiCabo VerdeCambodiaCameroonCanadaCaribbean small statesCentral African RepublicCentral Europe and the BalticsChadChileChinaColombiaComorosCongo, Dem. Rep.Congo, Rep.Costa RicaCote d'IvoireCroatiaCuracaoCyprusCzech RepublicDenmarkDjiboutiDominicaDominican RepublicEarly-demographic dividendEast Asia & PacificEast Asia & Pacific (excluding high income)East Asia & Pacific (IDA & IBRD countries)EcuadorEgypt, Arab Rep.El SalvadorEritreaEstoniaEthiopiaEuro areaEurope & Central AsiaEurope & Central Asia (excluding high income)Europe & Central Asia (IDA & IBRD countries)European UnionFaroe IslandsFijiFinlandFragile and conflict affected situationsFranceFrench PolynesiaGabonGambia, TheGeorgiaGermanyGhanaGreeceGrenadaGuatemalaGuineaGuinea-BissauGuyanaHaitiHeavily indebted poor countries (HIPC)High incomeHondurasHong Kong SAR, ChinaHungaryIBRD onlyIcelandIDA & IBRD totalIDA onlyIDA totalIndiaIndonesiaIran, Islamic Rep.IraqIrelandIsraelItalyJamaicaJapanJordanKazakhstanKenyaKiribatiKorea, Rep.KosovoKuwaitKyrgyz RepublicLao PDRLate-demographic dividendLatin America & Caribbean Latin America & Caribbean (excluding high income)Latin America & the Caribbean (IDA & IBRD countries)LatviaLeast developed countries: UN classificationLebanonLesothoLiberiaLibyaLithuaniaLow & middle incomeLow incomeLower middle incomeLuxembourgMacao SAR, ChinaMacedonia, FYRMadagascarMalawiMalaysiaMaldivesMaliMaltaMarshall IslandsMauritaniaMauritiusMexicoMicronesia, Fed. Sts.Middle East & North Africa (excluding high income)Middle East & North Africa (IDA & IBRD countries)Middle incomeMoldovaMongoliaMontenegroMoroccoMozambiqueMyanmarNamibiaNepalNetherlandsNew CaledoniaNew ZealandNicaraguaNigerNigeriaNorth AmericaNorwayOECD membersOmanOther small statesPacific island small statesPakistanPalauPanamaPapua New GuineaParaguayPeruPhilippinesPolandPortugalPost-demographic dividendPre-demographic dividendQatarRomaniaRussian FederationRwandaSamoaSao Tome and PrincipeSaudi ArabiaSenegalSerbiaSeychellesSierra LeoneSingaporeSint Maarten (Dutch part)Slovak RepublicSloveniaSmall statesSolomon IslandsSouth AfricaSouth AsiaSouth Asia (IDA & IBRD)South SudanSpainSri LankaSt. Kitts and NevisSt. LuciaSt. Vincent and the GrenadinesSub-Saharan Africa Sub-Saharan Africa (excluding high income)Sub-Saharan Africa (IDA & IBRD countries)SudanSurinameSwazilandSwedenSwitzerlandSyrian Arab RepublicTajikistanTanzaniaThailandTimor-LesteTogoTongaTrinidad and TobagoTunisiaTurkeyTuvaluUgandaUkraineUnited KingdomUnited StatesUpper middle incomeUruguayVanuatuVenezuela, RBWest Bank and GazaWorldYemen, Rep.ZambiaZimbabwe Linha do tempo:
Nesta escala de tempo está apresentado um gráfico de 1976 ano até 2016 ano Botswana. Dados de 1975 ano ausente. O número de observações reais por data: 41.
Fonte (nome):
Indicadores de desenvolvimento mundial
Fonte (organização):
International Monetary Fund, Balance of Payments Statistics Yearbook and data files.
Categorias:
Private Sector, Trade
Foi atualizado:
23 abr 2017 ano
Indicadores de alterações dos valores ao longo dos anos
Mínimo:
20.701
1 jan 1977 ano
Máximo:
84.861
1 jan 2013 ano
Na data de observação
Valor
Mudança absoluta
A alteração em relação ao valor anterior
1 jan 1976 ano
22.368
+22.368
0.0%
1 jan 1977 ano
20.701
-1.668
-7.46%
1 jan 1978 ano
22.961
+2.26
10.92%
1 jan 1979 ano
28.105
+5.144
22.4%
1 jan 1980 ano
38.532
+10.428
37.1%
1 jan 1981 ano
30.261
-8.271
-21.47%
1 jan 1982 ano
33.102
+2.841
9.39%
1 jan 1983 ano
39.898
+6.796
20.53%
1 jan 1984 ano
44.095
+4.197
10.52%
1 jan 1985 ano
44.926
+0.831
1.88%
1 jan 1986 ano
45.473
+0.547
1.22%
1 jan 1987 ano
54.934
+9.461
20.81%
1 jan 1988 ano
54.015
-0.919
-1.67%
1 jan 1989 ano
51.095
-2.92
-5.41%
1 jan 1990 ano
65.394
+14.299
27.99%
1 jan 1991 ano
64.082
-1.312
-2.01%
1 jan 1992 ano
70.098
+6.016
9.39%
1 jan 1993 ano
63.731
-6.367
-9.08%
1 jan 1994 ano
69.033
+5.302
8.32%
1 jan 1995 ano
70.862
+1.828
2.65%
1 jan 1996 ano
68.493
-2.369
-3.34%
1 jan 1997 ano
64.146
-4.347
-6.35%
1 jan 1998 ano
72.465
+8.319
12.97%
1 jan 1999 ano
72.774
+0.31
0.43%
1 jan 2000 ano
76.862
+4.088
5.62%
1 jan 2001 ano
72.681
-4.181
-5.44%
1 jan 2002 ano
67.182
-5.499
-7.57%
1 jan 2003 ano
72.394
+5.212
7.76%
1 jan 2004 ano
72.987
+0.593
0.82%
1 jan 2005 ano
73.948
+0.961
1.32%
1 jan 2006 ano
68.511
-5.437
-7.35%
1 jan 2007 ano
70.411
+1.9
2.77%
1 jan 2008 ano
65.323
-5.088
-7.23%
1 jan 2009 ano
79.114
+13.791
21.11%
1 jan 2010 ano
78.846
-0.268
-0.34%
1 jan 2011 ano
82.989
+4.143
5.25%
1 jan 2012 ano
74.663
-8.326
-10.03%
1 jan 2013 ano
84.861
+10.198
13.66%
1 jan 2014 ano
75.88
-8.981
-10.58%
1 jan 2015 ano
78.44
+2.559
3.37%
1 jan 2016 ano
80.744
+2.305
2.94%
Classificação de países por estatísticas atuais por anos


Comentários: