29
/pt/
pt
AIzaSyAYiBZKx7MnpbEhh9jyipgxe19OcubqV5w
April 1, 2024
211208
Nicaragua
NIC
true
2
1
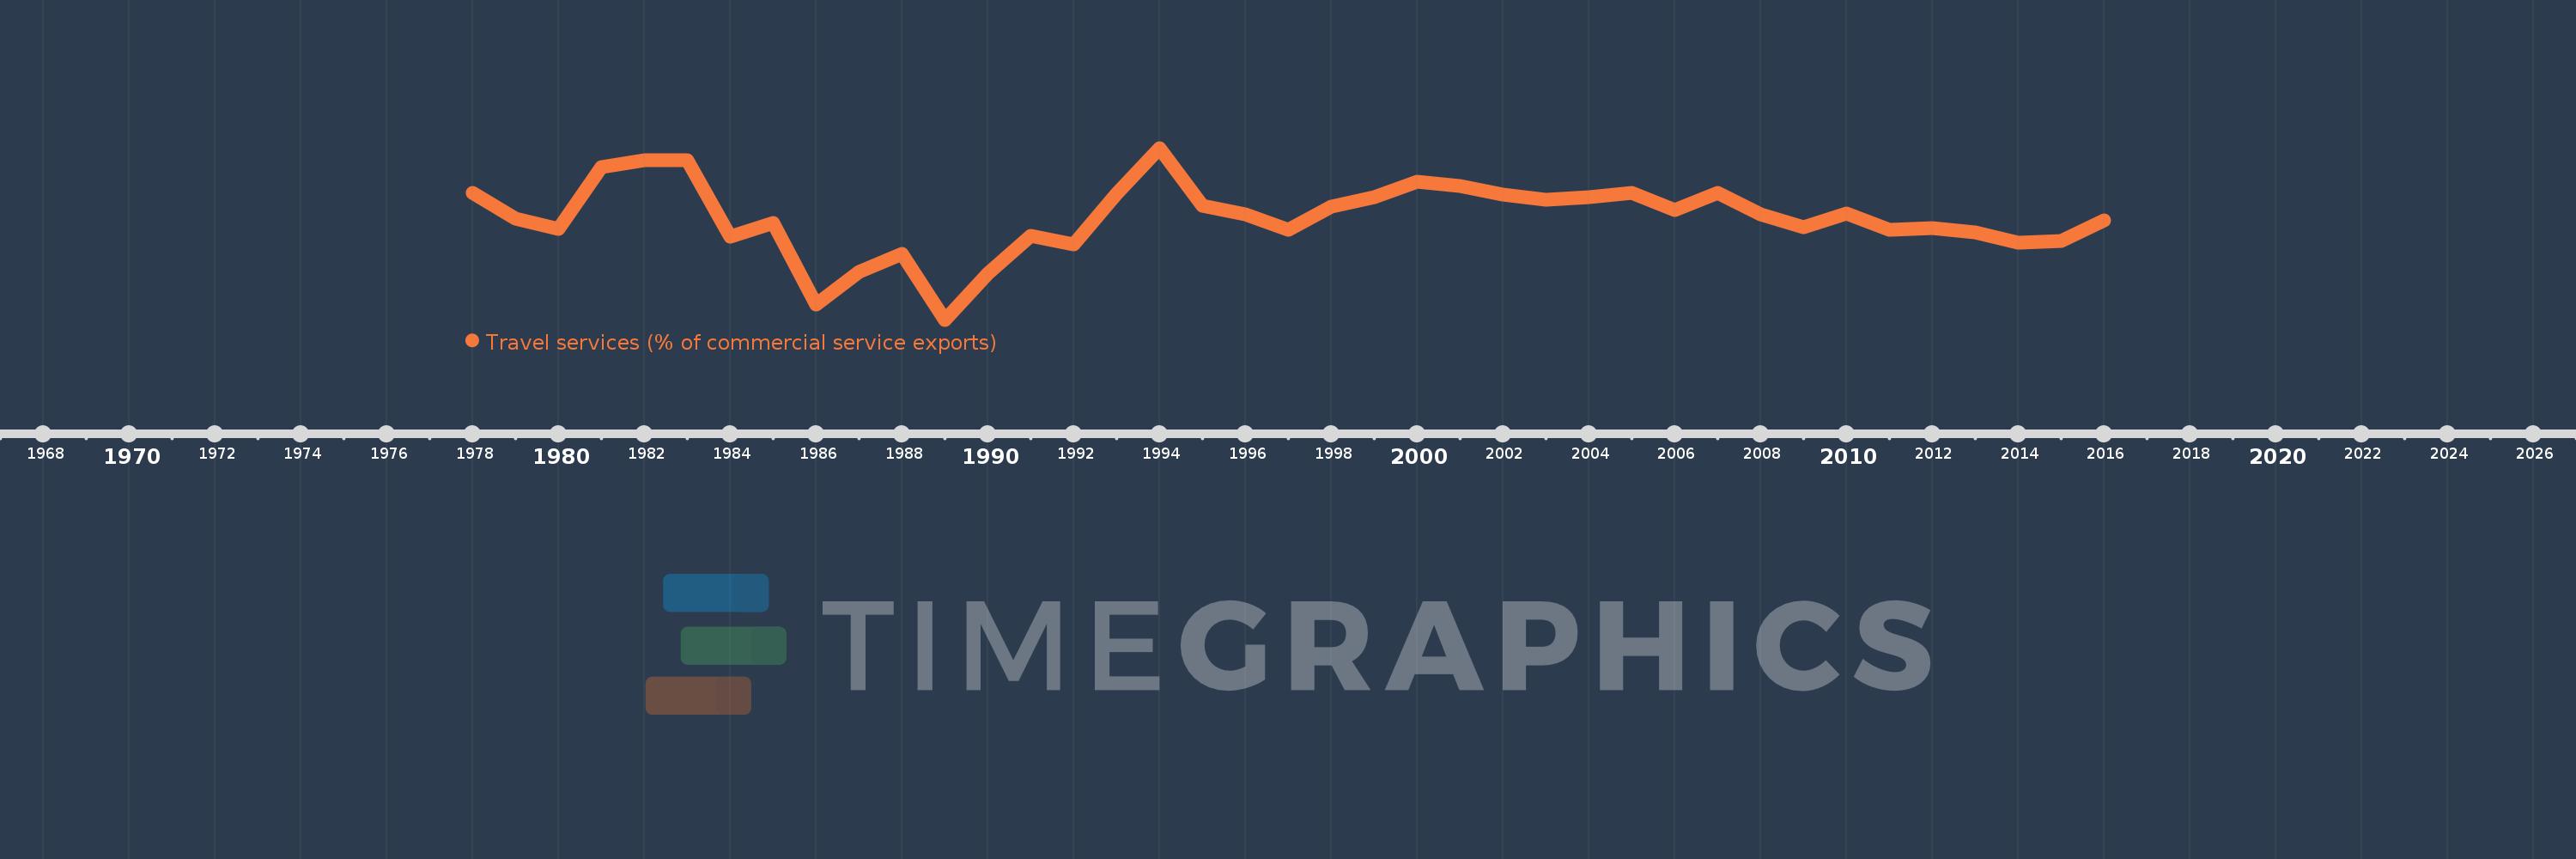
Travel services (% of commercial service exports)
2016,2015,2014,2013,2012,2011,2010,2009,2008,2007,2006,2005,2004,2003,2002,2001,2000,1999,1998,1997,1996,1995,1994,1993,1992,1991,1990,1989,1988,1987,1986,1985,1984,1983,1982,1981,1980,1979,1978
Estas estatísticas em outros países:
AfghanistanAlbaniaAlgeriaAngolaAntigua and BarbudaArab WorldArgentinaArmeniaArubaAustraliaAustriaAzerbaijanBahamas, TheBahrainBangladeshBarbadosBelarusBelgiumBelizeBeninBermudaBhutanBoliviaBosnia and HerzegovinaBotswanaBrazilBrunei DarussalamBulgariaBurkina FasoBurundiCabo VerdeCambodiaCameroonCanadaCaribbean small statesCentral African RepublicCentral Europe and the BalticsChadChileChinaColombiaComorosCongo, Dem. Rep.Congo, Rep.Costa RicaCote d'IvoireCroatiaCuracaoCyprusCzech RepublicDenmarkDjiboutiDominicaDominican RepublicEarly-demographic dividendEast Asia & PacificEast Asia & Pacific (excluding high income)East Asia & Pacific (IDA & IBRD countries)EcuadorEgypt, Arab Rep.El SalvadorEritreaEstoniaEthiopiaEuro areaEurope & Central AsiaEurope & Central Asia (excluding high income)Europe & Central Asia (IDA & IBRD countries)European UnionFaroe IslandsFijiFinlandFragile and conflict affected situationsFranceFrench PolynesiaGabonGambia, TheGeorgiaGermanyGhanaGreeceGrenadaGuatemalaGuineaGuinea-BissauGuyanaHaitiHeavily indebted poor countries (HIPC)High incomeHondurasHong Kong SAR, ChinaHungaryIBRD onlyIcelandIDA & IBRD totalIDA onlyIDA totalIndiaIndonesiaIran, Islamic Rep.IraqIrelandIsraelItalyJamaicaJapanJordanKazakhstanKenyaKiribatiKorea, Rep.KosovoKuwaitKyrgyz RepublicLao PDRLate-demographic dividendLatin America & Caribbean Latin America & Caribbean (excluding high income)Latin America & the Caribbean (IDA & IBRD countries)LatviaLeast developed countries: UN classificationLebanonLesothoLiberiaLibyaLithuaniaLow & middle incomeLow incomeLower middle incomeLuxembourgMacao SAR, ChinaMacedonia, FYRMadagascarMalawiMalaysiaMaldivesMaliMaltaMarshall IslandsMauritaniaMauritiusMexicoMicronesia, Fed. Sts.Middle East & North Africa (excluding high income)Middle East & North Africa (IDA & IBRD countries)Middle incomeMoldovaMongoliaMontenegroMoroccoMozambiqueMyanmarNamibiaNepalNetherlandsNew CaledoniaNew ZealandNicaraguaNigerNigeriaNorth AmericaNorwayOECD membersOmanOther small statesPacific island small statesPakistanPalauPanamaPapua New GuineaParaguayPeruPhilippinesPolandPortugalPost-demographic dividendPre-demographic dividendQatarRomaniaRussian FederationRwandaSamoaSao Tome and PrincipeSaudi ArabiaSenegalSerbiaSeychellesSierra LeoneSingaporeSint Maarten (Dutch part)Slovak RepublicSloveniaSmall statesSolomon IslandsSouth AfricaSouth AsiaSouth Asia (IDA & IBRD)South SudanSpainSri LankaSt. Kitts and NevisSt. LuciaSt. Vincent and the GrenadinesSub-Saharan Africa Sub-Saharan Africa (excluding high income)Sub-Saharan Africa (IDA & IBRD countries)SudanSurinameSwazilandSwedenSwitzerlandSyrian Arab RepublicTajikistanTanzaniaThailandTimor-LesteTogoTongaTrinidad and TobagoTunisiaTurkeyTuvaluUgandaUkraineUnited KingdomUnited StatesUpper middle incomeUruguayVanuatuVenezuela, RBWest Bank and GazaWorldYemen, Rep.ZambiaZimbabwe Linha do tempo:
Nesta escala de tempo está apresentado um gráfico de 1978 ano até 2016 ano Nicaragua. Dados de 1977 ano ausente. O número de observações reais por data: 39.
Fonte (nome):
Indicadores de desenvolvimento mundial
Fonte (organização):
International Monetary Fund, Balance of Payments Statistics Yearbook and data files.
Categorias:
Private Sector, Trade
Foi atualizado:
23 abr 2017 ano
Indicadores de alterações dos valores ao longo dos anos
Mínimo:
14.439
1 jan 1989 ano
Máximo:
57.402
1 jan 1994 ano
Na data de observação
Valor
Mudança absoluta
A alteração em relação ao valor anterior
1 jan 1978 ano
46.248
+46.248
0.0%
1 jan 1979 ano
39.717
-6.531
-14.12%
1 jan 1980 ano
37.045
-2.673
-6.73%
1 jan 1981 ano
52.683
+15.638
42.22%
1 jan 1982 ano
54.348
+1.665
3.16%
1 jan 1983 ano
54.348
0.0
0.0%
1 jan 1984 ano
35.112
-19.235
-35.39%
1 jan 1985 ano
38.596
+3.484
9.92%
1 jan 1986 ano
18.321
-20.276
-52.53%
1 jan 1987 ano
26.441
+8.12
44.32%
1 jan 1988 ano
30.847
+4.407
16.67%
1 jan 1989 ano
14.439
-16.409
-53.19%
1 jan 1990 ano
26.061
+11.622
80.49%
1 jan 1991 ano
35.465
+9.405
36.09%
1 jan 1992 ano
33.267
-2.198
-6.2%
1 jan 1993 ano
46.047
+12.78
38.42%
1 jan 1994 ano
57.402
+11.355
24.66%
1 jan 1995 ano
43.044
-14.358
-25.01%
1 jan 1996 ano
40.767
-2.277
-5.29%
1 jan 1997 ano
36.99
-3.778
-9.27%
1 jan 1998 ano
42.826
+5.837
15.78%
1 jan 1999 ano
45.199
+2.373
5.54%
1 jan 2000 ano
49.055
+3.856
8.53%
1 jan 2001 ano
47.824
-1.231
-2.51%
1 jan 2002 ano
45.709
-2.115
-4.42%
1 jan 2003 ano
44.525
-1.184
-2.59%
1 jan 2004 ano
45.165
+0.64
1.44%
1 jan 2005 ano
46.087
+0.922
2.04%
1 jan 2006 ano
41.812
-4.275
-9.28%
1 jan 2007 ano
46.157
+4.345
10.39%
1 jan 2008 ano
40.79
-5.367
-11.63%
1 jan 2009 ano
37.498
-3.291
-8.07%
1 jan 2010 ano
41.101
+3.603
9.61%
1 jan 2011 ano
36.869
-4.232
-10.3%
1 jan 2012 ano
37.253
+0.384
1.04%
1 jan 2013 ano
36.382
-0.871
-2.34%
1 jan 2014 ano
33.732
-2.649
-7.28%
1 jan 2015 ano
34.204
+0.471
1.4%
1 jan 2016 ano
39.392
+5.188
15.17%
Classificação de países por estatísticas atuais por anos


Comentários: