29
/pt/
pt
AIzaSyAYiBZKx7MnpbEhh9jyipgxe19OcubqV5w
April 1, 2024
236591
Senegal
SEN
true
2
1
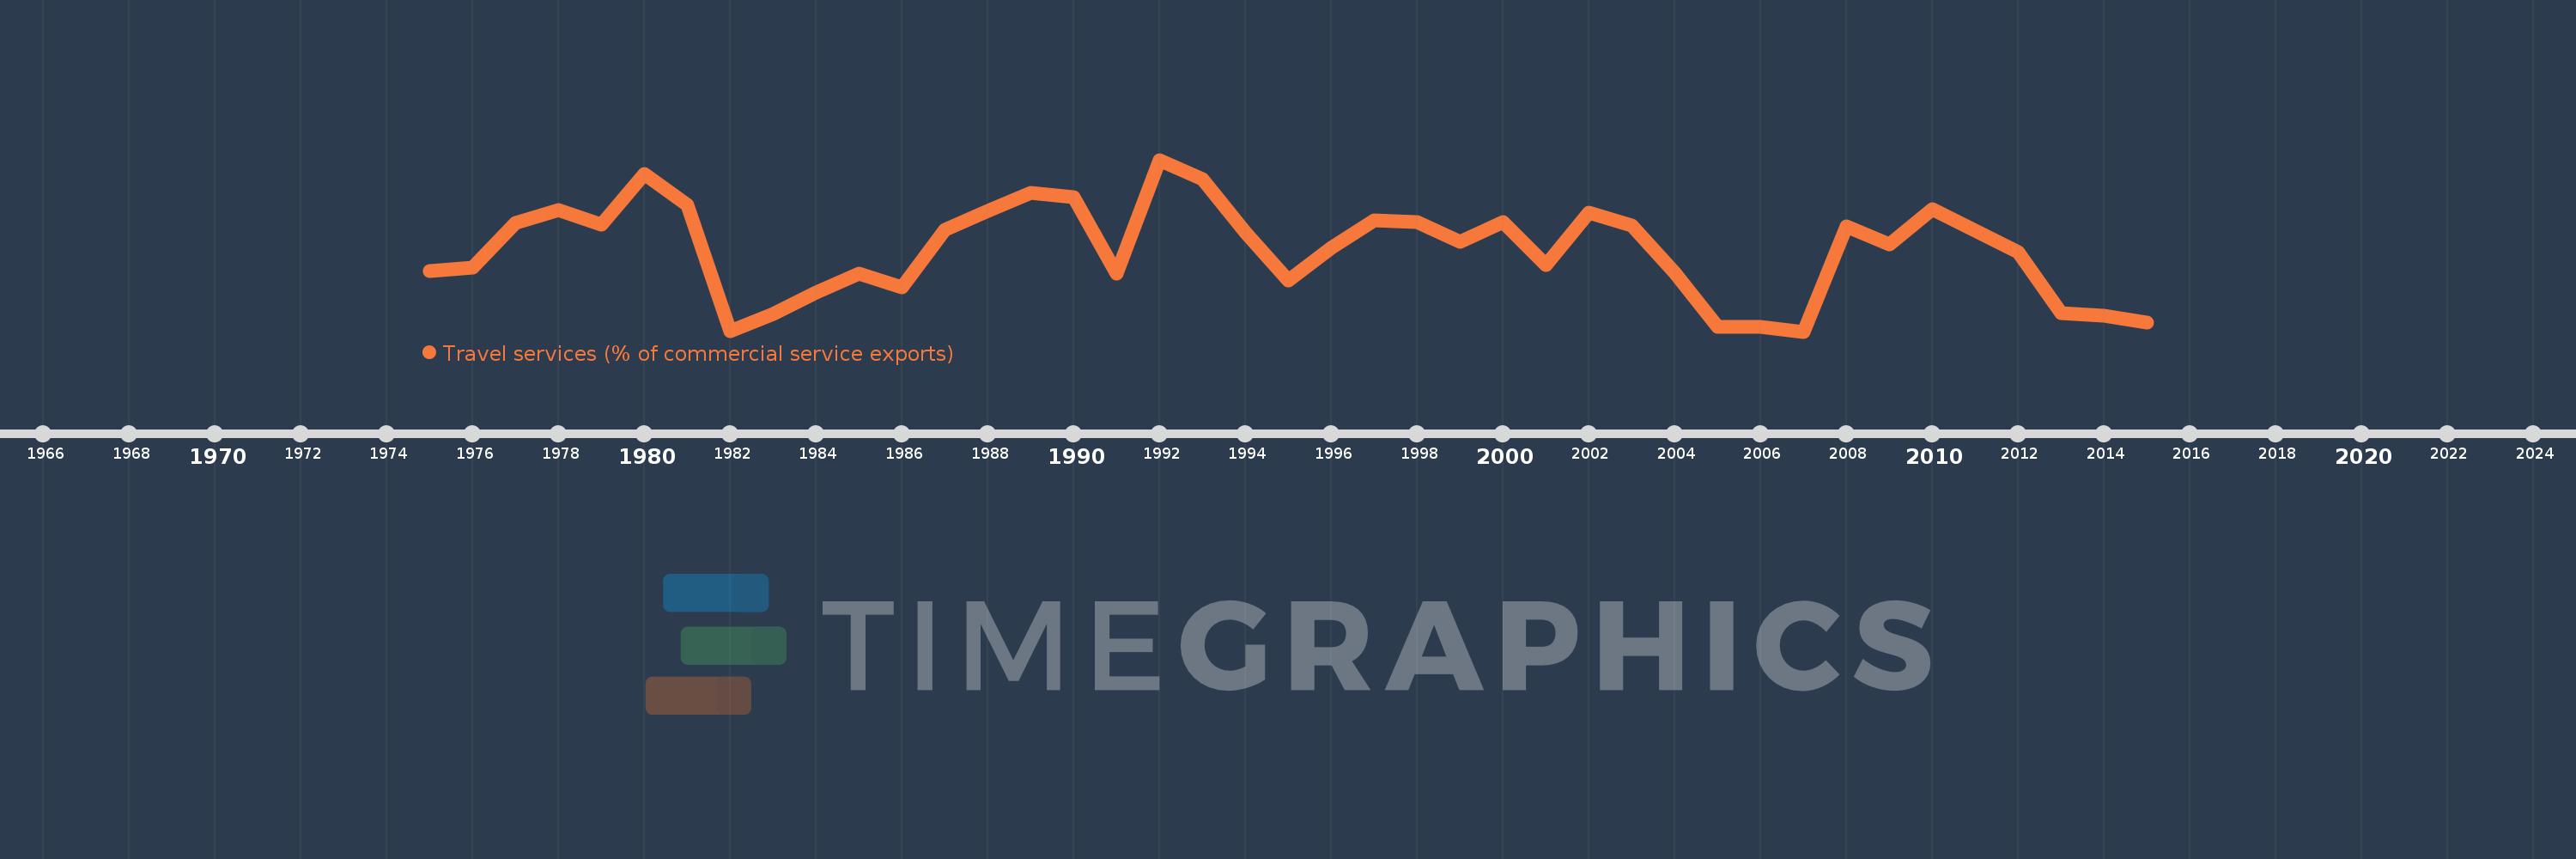
Travel services (% of commercial service exports)
2015,2014,2013,2012,2011,2010,2009,2008,2007,2006,2005,2004,2003,2002,2001,2000,1999,1998,1997,1996,1995,1994,1993,1992,1991,1990,1989,1988,1987,1986,1985,1984,1983,1982,1981,1980,1979,1978,1977,1976,1975
Estas estatísticas em outros países:
AfghanistanAlbaniaAlgeriaAngolaAntigua and BarbudaArab WorldArgentinaArmeniaArubaAustraliaAustriaAzerbaijanBahamas, TheBahrainBangladeshBarbadosBelarusBelgiumBelizeBeninBermudaBhutanBoliviaBosnia and HerzegovinaBotswanaBrazilBrunei DarussalamBulgariaBurkina FasoBurundiCabo VerdeCambodiaCameroonCanadaCaribbean small statesCentral African RepublicCentral Europe and the BalticsChadChileChinaColombiaComorosCongo, Dem. Rep.Congo, Rep.Costa RicaCote d'IvoireCroatiaCuracaoCyprusCzech RepublicDenmarkDjiboutiDominicaDominican RepublicEarly-demographic dividendEast Asia & PacificEast Asia & Pacific (excluding high income)East Asia & Pacific (IDA & IBRD countries)EcuadorEgypt, Arab Rep.El SalvadorEritreaEstoniaEthiopiaEuro areaEurope & Central AsiaEurope & Central Asia (excluding high income)Europe & Central Asia (IDA & IBRD countries)European UnionFaroe IslandsFijiFinlandFragile and conflict affected situationsFranceFrench PolynesiaGabonGambia, TheGeorgiaGermanyGhanaGreeceGrenadaGuatemalaGuineaGuinea-BissauGuyanaHaitiHeavily indebted poor countries (HIPC)High incomeHondurasHong Kong SAR, ChinaHungaryIBRD onlyIcelandIDA & IBRD totalIDA onlyIDA totalIndiaIndonesiaIran, Islamic Rep.IraqIrelandIsraelItalyJamaicaJapanJordanKazakhstanKenyaKiribatiKorea, Rep.KosovoKuwaitKyrgyz RepublicLao PDRLate-demographic dividendLatin America & Caribbean Latin America & Caribbean (excluding high income)Latin America & the Caribbean (IDA & IBRD countries)LatviaLeast developed countries: UN classificationLebanonLesothoLiberiaLibyaLithuaniaLow & middle incomeLow incomeLower middle incomeLuxembourgMacao SAR, ChinaMacedonia, FYRMadagascarMalawiMalaysiaMaldivesMaliMaltaMarshall IslandsMauritaniaMauritiusMexicoMicronesia, Fed. Sts.Middle East & North Africa (excluding high income)Middle East & North Africa (IDA & IBRD countries)Middle incomeMoldovaMongoliaMontenegroMoroccoMozambiqueMyanmarNamibiaNepalNetherlandsNew CaledoniaNew ZealandNicaraguaNigerNigeriaNorth AmericaNorwayOECD membersOmanOther small statesPacific island small statesPakistanPalauPanamaPapua New GuineaParaguayPeruPhilippinesPolandPortugalPost-demographic dividendPre-demographic dividendQatarRomaniaRussian FederationRwandaSamoaSao Tome and PrincipeSaudi ArabiaSenegalSerbiaSeychellesSierra LeoneSingaporeSint Maarten (Dutch part)Slovak RepublicSloveniaSmall statesSolomon IslandsSouth AfricaSouth AsiaSouth Asia (IDA & IBRD)South SudanSpainSri LankaSt. Kitts and NevisSt. LuciaSt. Vincent and the GrenadinesSub-Saharan Africa Sub-Saharan Africa (excluding high income)Sub-Saharan Africa (IDA & IBRD countries)SudanSurinameSwazilandSwedenSwitzerlandSyrian Arab RepublicTajikistanTanzaniaThailandTimor-LesteTogoTongaTrinidad and TobagoTunisiaTurkeyTuvaluUgandaUkraineUnited KingdomUnited StatesUpper middle incomeUruguayVanuatuVenezuela, RBWest Bank and GazaWorldYemen, Rep.ZambiaZimbabwe Linha do tempo:
Nesta escala de tempo está apresentado um gráfico de 1975 ano até 2015 ano Senegal. Dados de 1974 ano ausente. O número de observações reais por data: 41.
Fonte (nome):
Indicadores de desenvolvimento mundial
Fonte (organização):
International Monetary Fund, Balance of Payments Statistics Yearbook and data files.
Categorias:
Private Sector, Trade
Foi atualizado:
23 abr 2017 ano
Indicadores de alterações dos valores ao longo dos anos
Mínimo:
35.278
1 jan 2007 ano
Máximo:
57.455
1 jan 1992 ano
Na data de observação
Valor
Mudança absoluta
A alteração em relação ao valor anterior
1 jan 1975 ano
43.144
+43.144
0.0%
1 jan 1976 ano
43.566
+0.421
0.98%
1 jan 1977 ano
49.259
+5.694
13.07%
1 jan 1978 ano
50.923
+1.664
3.38%
1 jan 1979 ano
49.08
-1.843
-3.62%
1 jan 1980 ano
55.606
+6.526
13.3%
1 jan 1981 ano
51.595
-4.011
-7.21%
1 jan 1982 ano
35.315
-16.279
-31.55%
1 jan 1983 ano
37.522
+2.207
6.25%
1 jan 1984 ano
40.302
+2.78
7.41%
1 jan 1985 ano
42.781
+2.479
6.15%
1 jan 1986 ano
41.001
-1.78
-4.16%
1 jan 1987 ano
48.413
+7.412
18.08%
1 jan 1988 ano
50.817
+2.404
4.96%
1 jan 1989 ano
53.179
+2.362
4.65%
1 jan 1990 ano
52.59
-0.589
-1.11%
1 jan 1991 ano
42.75
-9.84
-18.71%
1 jan 1992 ano
57.455
+14.706
34.4%
1 jan 1993 ano
54.988
-2.467
-4.29%
1 jan 1994 ano
48.068
-6.92
-12.58%
1 jan 1995 ano
41.898
-6.17
-12.84%
1 jan 1996 ano
46.114
+4.217
10.06%
1 jan 1997 ano
49.599
+3.485
7.56%
1 jan 1998 ano
49.467
-0.133
-0.27%
1 jan 1999 ano
46.854
-2.612
-5.28%
1 jan 2000 ano
49.443
+2.589
5.52%
1 jan 2001 ano
43.883
-5.56
-11.25%
1 jan 2002 ano
50.602
+6.719
15.31%
1 jan 2003 ano
49.025
-1.576
-3.12%
1 jan 2004 ano
42.915
-6.11
-12.46%
1 jan 2005 ano
35.884
-7.031
-16.38%
1 jan 2006 ano
35.931
+0.047
0.13%
1 jan 2007 ano
35.278
-0.653
-1.82%
1 jan 2008 ano
48.84
+13.562
38.44%
1 jan 2009 ano
46.48
-2.36
-4.83%
1 jan 2010 ano
51.129
+4.649
10.0%
1 jan 2011 ano
48.357
-2.773
-5.42%
1 jan 2012 ano
45.497
-2.86
-5.91%
1 jan 2013 ano
37.686
-7.811
-17.17%
1 jan 2014 ano
37.287
-0.399
-1.06%
1 jan 2015 ano
36.392
-0.895
-2.4%
Classificação de países por estatísticas atuais por anos


Comentários: