29
/pt/
pt
AIzaSyAYiBZKx7MnpbEhh9jyipgxe19OcubqV5w
April 1, 2024
53131
OECD members
OED
false
2
1
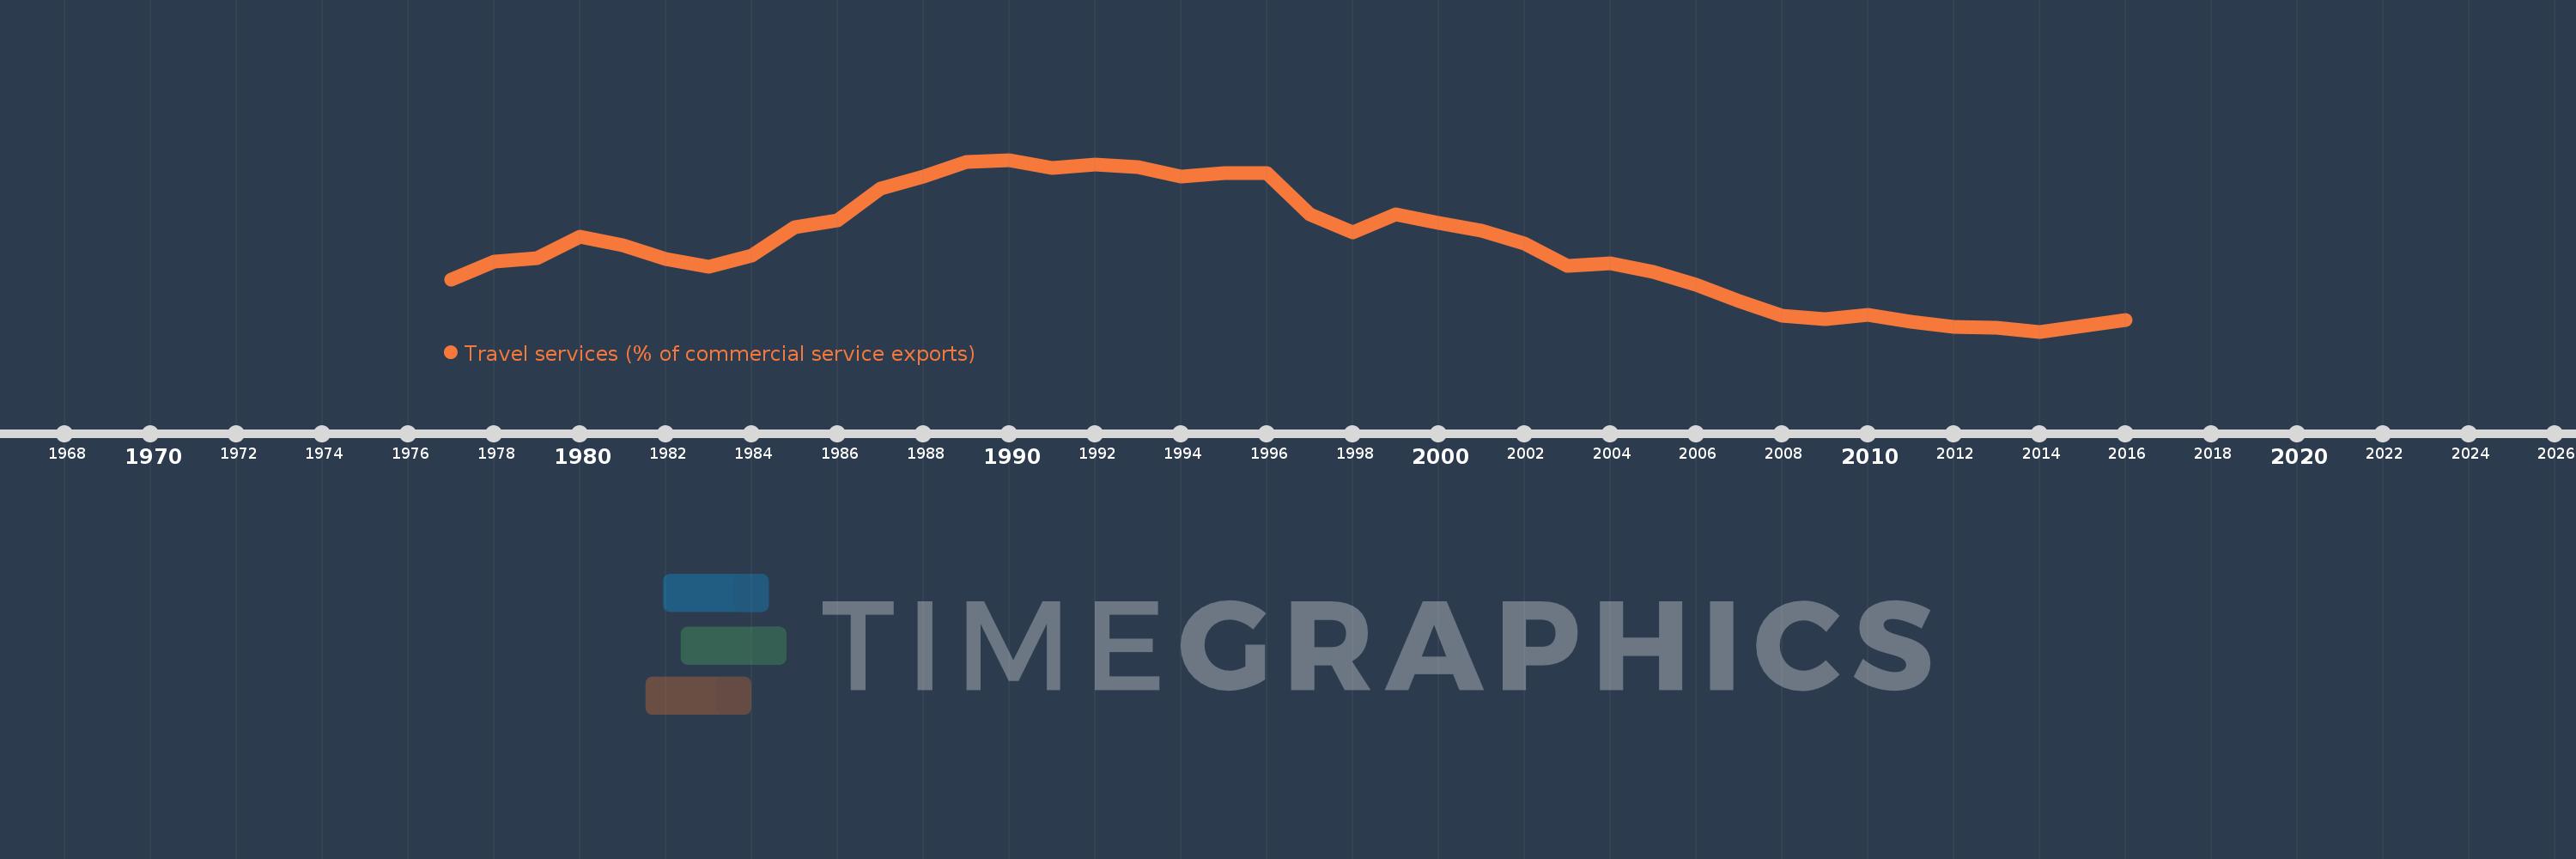
Travel services (% of commercial service exports)
2016,2015,2014,2013,2012,2011,2010,2009,2008,2007,2006,2005,2004,2003,2002,2001,2000,1999,1998,1997,1996,1995,1994,1993,1992,1991,1990,1989,1988,1987,1986,1985,1984,1983,1982,1981,1980,1979,1978,1977
Estas estatísticas em outros países:
AfghanistanAlbaniaAlgeriaAngolaAntigua and BarbudaArab WorldArgentinaArmeniaArubaAustraliaAustriaAzerbaijanBahamas, TheBahrainBangladeshBarbadosBelarusBelgiumBelizeBeninBermudaBhutanBoliviaBosnia and HerzegovinaBotswanaBrazilBrunei DarussalamBulgariaBurkina FasoBurundiCabo VerdeCambodiaCameroonCanadaCaribbean small statesCentral African RepublicCentral Europe and the BalticsChadChileChinaColombiaComorosCongo, Dem. Rep.Congo, Rep.Costa RicaCote d'IvoireCroatiaCuracaoCyprusCzech RepublicDenmarkDjiboutiDominicaDominican RepublicEarly-demographic dividendEast Asia & PacificEast Asia & Pacific (excluding high income)East Asia & Pacific (IDA & IBRD countries)EcuadorEgypt, Arab Rep.El SalvadorEritreaEstoniaEthiopiaEuro areaEurope & Central AsiaEurope & Central Asia (excluding high income)Europe & Central Asia (IDA & IBRD countries)European UnionFaroe IslandsFijiFinlandFragile and conflict affected situationsFranceFrench PolynesiaGabonGambia, TheGeorgiaGermanyGhanaGreeceGrenadaGuatemalaGuineaGuinea-BissauGuyanaHaitiHeavily indebted poor countries (HIPC)High incomeHondurasHong Kong SAR, ChinaHungaryIBRD onlyIcelandIDA & IBRD totalIDA onlyIDA totalIndiaIndonesiaIran, Islamic Rep.IraqIrelandIsraelItalyJamaicaJapanJordanKazakhstanKenyaKiribatiKorea, Rep.KosovoKuwaitKyrgyz RepublicLao PDRLate-demographic dividendLatin America & Caribbean Latin America & Caribbean (excluding high income)Latin America & the Caribbean (IDA & IBRD countries)LatviaLeast developed countries: UN classificationLebanonLesothoLiberiaLibyaLithuaniaLow & middle incomeLow incomeLower middle incomeLuxembourgMacao SAR, ChinaMacedonia, FYRMadagascarMalawiMalaysiaMaldivesMaliMaltaMarshall IslandsMauritaniaMauritiusMexicoMicronesia, Fed. Sts.Middle East & North Africa (excluding high income)Middle East & North Africa (IDA & IBRD countries)Middle incomeMoldovaMongoliaMontenegroMoroccoMozambiqueMyanmarNamibiaNepalNetherlandsNew CaledoniaNew ZealandNicaraguaNigerNigeriaNorth AmericaNorwayOECD membersOmanOther small statesPacific island small statesPakistanPalauPanamaPapua New GuineaParaguayPeruPhilippinesPolandPortugalPost-demographic dividendPre-demographic dividendQatarRomaniaRussian FederationRwandaSamoaSao Tome and PrincipeSaudi ArabiaSenegalSerbiaSeychellesSierra LeoneSingaporeSint Maarten (Dutch part)Slovak RepublicSloveniaSmall statesSolomon IslandsSouth AfricaSouth AsiaSouth Asia (IDA & IBRD)South SudanSpainSri LankaSt. Kitts and NevisSt. LuciaSt. Vincent and the GrenadinesSub-Saharan Africa Sub-Saharan Africa (excluding high income)Sub-Saharan Africa (IDA & IBRD countries)SudanSurinameSwazilandSwedenSwitzerlandSyrian Arab RepublicTajikistanTanzaniaThailandTimor-LesteTogoTongaTrinidad and TobagoTunisiaTurkeyTuvaluUgandaUkraineUnited KingdomUnited StatesUpper middle incomeUruguayVanuatuVenezuela, RBWest Bank and GazaWorldYemen, Rep.ZambiaZimbabwe Linha do tempo:
Nesta escala de tempo está apresentado um gráfico de 1977 ano até 2016 ano OECD members. Dados de 1976 ano ausente. O número de observações reais por data: 40.
Fonte (nome):
Indicadores de desenvolvimento mundial
Fonte (organização):
International Monetary Fund, Balance of Payments Statistics Yearbook and data files.
Categorias:
Private Sector, Trade
Foi atualizado:
23 abr 2017 ano
Indicadores de alterações dos valores ao longo dos anos
Mínimo:
22.944
1 jan 2014 ano
Máximo:
33.278
1 jan 1990 ano
Na data de observação
Valor
Mudança absoluta
A alteração em relação ao valor anterior
1 jan 1977 ano
26.06
+26.06
0.0%
1 jan 1978 ano
27.131
+1.071
4.11%
1 jan 1979 ano
27.382
+0.251
0.93%
1 jan 1980 ano
28.628
+1.246
4.55%
1 jan 1981 ano
28.122
-0.506
-1.77%
1 jan 1982 ano
27.299
-0.823
-2.93%
1 jan 1983 ano
26.841
-0.458
-1.68%
1 jan 1984 ano
27.509
+0.668
2.49%
1 jan 1985 ano
29.225
+1.716
6.24%
1 jan 1986 ano
29.634
+0.409
1.4%
1 jan 1987 ano
31.564
+1.931
6.52%
1 jan 1988 ano
32.262
+0.697
2.21%
1 jan 1989 ano
33.147
+0.885
2.74%
1 jan 1990 ano
33.278
+0.131
0.4%
1 jan 1991 ano
32.778
-0.5
-1.5%
1 jan 1992 ano
32.978
+0.2
0.61%
1 jan 1993 ano
32.864
-0.115
-0.35%
1 jan 1994 ano
32.254
-0.61
-1.86%
1 jan 1995 ano
32.474
+0.22
0.68%
1 jan 1996 ano
32.463
-0.011
-0.03%
1 jan 1997 ano
29.999
-2.464
-7.59%
1 jan 1998 ano
28.914
-1.085
-3.62%
1 jan 1999 ano
29.989
+1.075
3.72%
1 jan 2000 ano
29.478
-0.511
-1.7%
1 jan 2001 ano
29.003
-0.475
-1.61%
1 jan 2002 ano
28.252
-0.751
-2.59%
1 jan 2003 ano
26.913
-1.339
-4.74%
1 jan 2004 ano
27.059
+0.146
0.54%
1 jan 2005 ano
26.538
-0.52
-1.92%
1 jan 2006 ano
25.78
-0.758
-2.86%
1 jan 2007 ano
24.781
-0.998
-3.87%
1 jan 2008 ano
23.922
-0.859
-3.47%
1 jan 2009 ano
23.701
-0.221
-0.92%
1 jan 2010 ano
23.946
+0.245
1.03%
1 jan 2011 ano
23.536
-0.41
-1.71%
1 jan 2012 ano
23.252
-0.284
-1.21%
1 jan 2013 ano
23.183
-0.069
-0.3%
1 jan 2014 ano
22.944
-0.239
-1.03%
1 jan 2015 ano
23.284
+0.34
1.48%
1 jan 2016 ano
23.621
+0.337
1.45%
Classificação de países por estatísticas atuais por anos


Comentários: