29
/pt/
pt
AIzaSyAYiBZKx7MnpbEhh9jyipgxe19OcubqV5w
April 1, 2024
33952
European Union
EUU
false
2
1
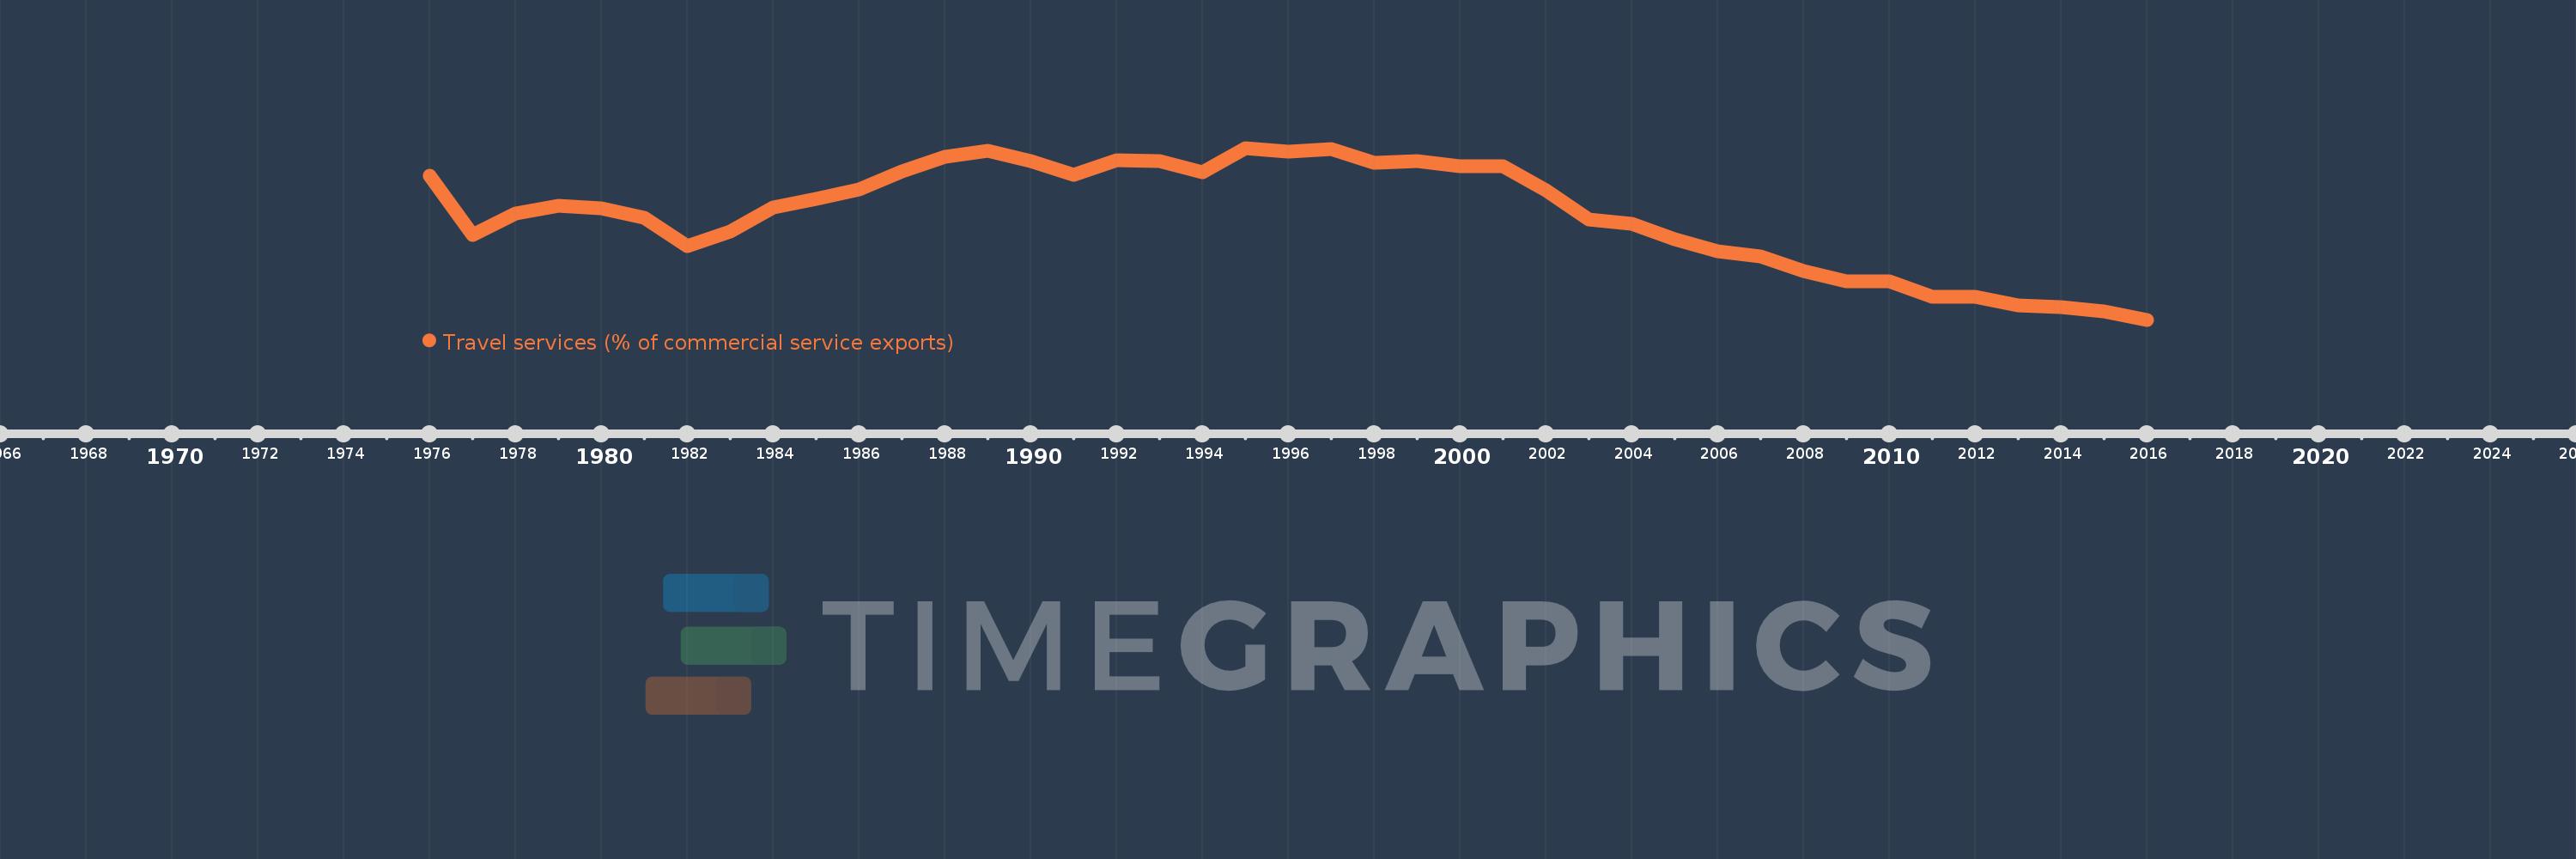
Travel services (% of commercial service exports)
2016,2015,2014,2013,2012,2011,2010,2009,2008,2007,2006,2005,2004,2003,2002,2001,2000,1999,1998,1997,1996,1995,1994,1993,1992,1991,1990,1989,1988,1987,1986,1985,1984,1983,1982,1981,1980,1979,1978,1977,1976
Estas estatísticas em outros países:
AfghanistanAlbaniaAlgeriaAngolaAntigua and BarbudaArab WorldArgentinaArmeniaArubaAustraliaAustriaAzerbaijanBahamas, TheBahrainBangladeshBarbadosBelarusBelgiumBelizeBeninBermudaBhutanBoliviaBosnia and HerzegovinaBotswanaBrazilBrunei DarussalamBulgariaBurkina FasoBurundiCabo VerdeCambodiaCameroonCanadaCaribbean small statesCentral African RepublicCentral Europe and the BalticsChadChileChinaColombiaComorosCongo, Dem. Rep.Congo, Rep.Costa RicaCote d'IvoireCroatiaCuracaoCyprusCzech RepublicDenmarkDjiboutiDominicaDominican RepublicEarly-demographic dividendEast Asia & PacificEast Asia & Pacific (excluding high income)East Asia & Pacific (IDA & IBRD countries)EcuadorEgypt, Arab Rep.El SalvadorEritreaEstoniaEthiopiaEuro areaEurope & Central AsiaEurope & Central Asia (excluding high income)Europe & Central Asia (IDA & IBRD countries)European UnionFaroe IslandsFijiFinlandFragile and conflict affected situationsFranceFrench PolynesiaGabonGambia, TheGeorgiaGermanyGhanaGreeceGrenadaGuatemalaGuineaGuinea-BissauGuyanaHaitiHeavily indebted poor countries (HIPC)High incomeHondurasHong Kong SAR, ChinaHungaryIBRD onlyIcelandIDA & IBRD totalIDA onlyIDA totalIndiaIndonesiaIran, Islamic Rep.IraqIrelandIsraelItalyJamaicaJapanJordanKazakhstanKenyaKiribatiKorea, Rep.KosovoKuwaitKyrgyz RepublicLao PDRLate-demographic dividendLatin America & Caribbean Latin America & Caribbean (excluding high income)Latin America & the Caribbean (IDA & IBRD countries)LatviaLeast developed countries: UN classificationLebanonLesothoLiberiaLibyaLithuaniaLow & middle incomeLow incomeLower middle incomeLuxembourgMacao SAR, ChinaMacedonia, FYRMadagascarMalawiMalaysiaMaldivesMaliMaltaMarshall IslandsMauritaniaMauritiusMexicoMicronesia, Fed. Sts.Middle East & North Africa (excluding high income)Middle East & North Africa (IDA & IBRD countries)Middle incomeMoldovaMongoliaMontenegroMoroccoMozambiqueMyanmarNamibiaNepalNetherlandsNew CaledoniaNew ZealandNicaraguaNigerNigeriaNorth AmericaNorwayOECD membersOmanOther small statesPacific island small statesPakistanPalauPanamaPapua New GuineaParaguayPeruPhilippinesPolandPortugalPost-demographic dividendPre-demographic dividendQatarRomaniaRussian FederationRwandaSamoaSao Tome and PrincipeSaudi ArabiaSenegalSerbiaSeychellesSierra LeoneSingaporeSint Maarten (Dutch part)Slovak RepublicSloveniaSmall statesSolomon IslandsSouth AfricaSouth AsiaSouth Asia (IDA & IBRD)South SudanSpainSri LankaSt. Kitts and NevisSt. LuciaSt. Vincent and the GrenadinesSub-Saharan Africa Sub-Saharan Africa (excluding high income)Sub-Saharan Africa (IDA & IBRD countries)SudanSurinameSwazilandSwedenSwitzerlandSyrian Arab RepublicTajikistanTanzaniaThailandTimor-LesteTogoTongaTrinidad and TobagoTunisiaTurkeyTuvaluUgandaUkraineUnited KingdomUnited StatesUpper middle incomeUruguayVanuatuVenezuela, RBWest Bank and GazaWorldYemen, Rep.ZambiaZimbabwe Linha do tempo:
Nesta escala de tempo está apresentado um gráfico de 1976 ano até 2016 ano European Union. Dados de 1975 ano ausente. O número de observações reais por data: 41.
Fonte (nome):
Indicadores de desenvolvimento mundial
Fonte (organização):
International Monetary Fund, Balance of Payments Statistics Yearbook and data files.
Categorias:
Private Sector, Trade
Foi atualizado:
23 abr 2017 ano
Indicadores de alterações dos valores ao longo dos anos
Mínimo:
19.714
1 jan 2016 ano
Máximo:
31.228
1 jan 1995 ano
Na data de observação
Valor
Mudança absoluta
A alteração em relação ao valor anterior
1 jan 1976 ano
29.381
+29.381
0.0%
1 jan 1977 ano
25.387
-3.994
-13.59%
1 jan 1978 ano
26.853
+1.466
5.78%
1 jan 1979 ano
27.325
+0.472
1.76%
1 jan 1980 ano
27.163
-0.162
-0.59%
1 jan 1981 ano
26.575
-0.588
-2.17%
1 jan 1982 ano
24.662
-1.912
-7.2%
1 jan 1983 ano
25.639
+0.977
3.96%
1 jan 1984 ano
27.229
+1.59
6.2%
1 jan 1985 ano
27.838
+0.609
2.24%
1 jan 1986 ano
28.427
+0.589
2.12%
1 jan 1987 ano
29.639
+1.211
4.26%
1 jan 1988 ano
30.663
+1.024
3.46%
1 jan 1989 ano
31.011
+0.349
1.14%
1 jan 1990 ano
30.36
-0.652
-2.1%
1 jan 1991 ano
29.454
-0.905
-2.98%
1 jan 1992 ano
30.424
+0.97
3.29%
1 jan 1993 ano
30.36
-0.064
-0.21%
1 jan 1994 ano
29.622
-0.738
-2.43%
1 jan 1995 ano
31.228
+1.605
5.42%
1 jan 1996 ano
30.973
-0.254
-0.81%
1 jan 1997 ano
31.17
+0.197
0.63%
1 jan 1998 ano
30.231
-0.938
-3.01%
1 jan 1999 ano
30.354
+0.123
0.41%
1 jan 2000 ano
29.985
-0.369
-1.21%
1 jan 2001 ano
29.986
+0.001
0.0%
1 jan 2002 ano
28.412
-1.574
-5.25%
1 jan 2003 ano
26.434
-1.978
-6.96%
1 jan 2004 ano
26.123
-0.312
-1.18%
1 jan 2005 ano
25.119
-1.004
-3.84%
1 jan 2006 ano
24.314
-0.805
-3.2%
1 jan 2007 ano
23.936
-0.378
-1.56%
1 jan 2008 ano
22.978
-0.957
-4.0%
1 jan 2009 ano
22.294
-0.684
-2.98%
1 jan 2010 ano
22.3
+0.006
0.03%
1 jan 2011 ano
21.23
-1.07
-4.8%
1 jan 2012 ano
21.271
+0.042
0.2%
1 jan 2013 ano
20.656
-0.615
-2.89%
1 jan 2014 ano
20.533
-0.123
-0.6%
1 jan 2015 ano
20.259
-0.274
-1.33%
1 jan 2016 ano
19.714
-0.546
-2.69%
Classificação de países por estatísticas atuais por anos


Comentários: