29
/pt/
pt
AIzaSyAYiBZKx7MnpbEhh9jyipgxe19OcubqV5w
April 1, 2024
268818
Tunisia
TUN
true
2
1
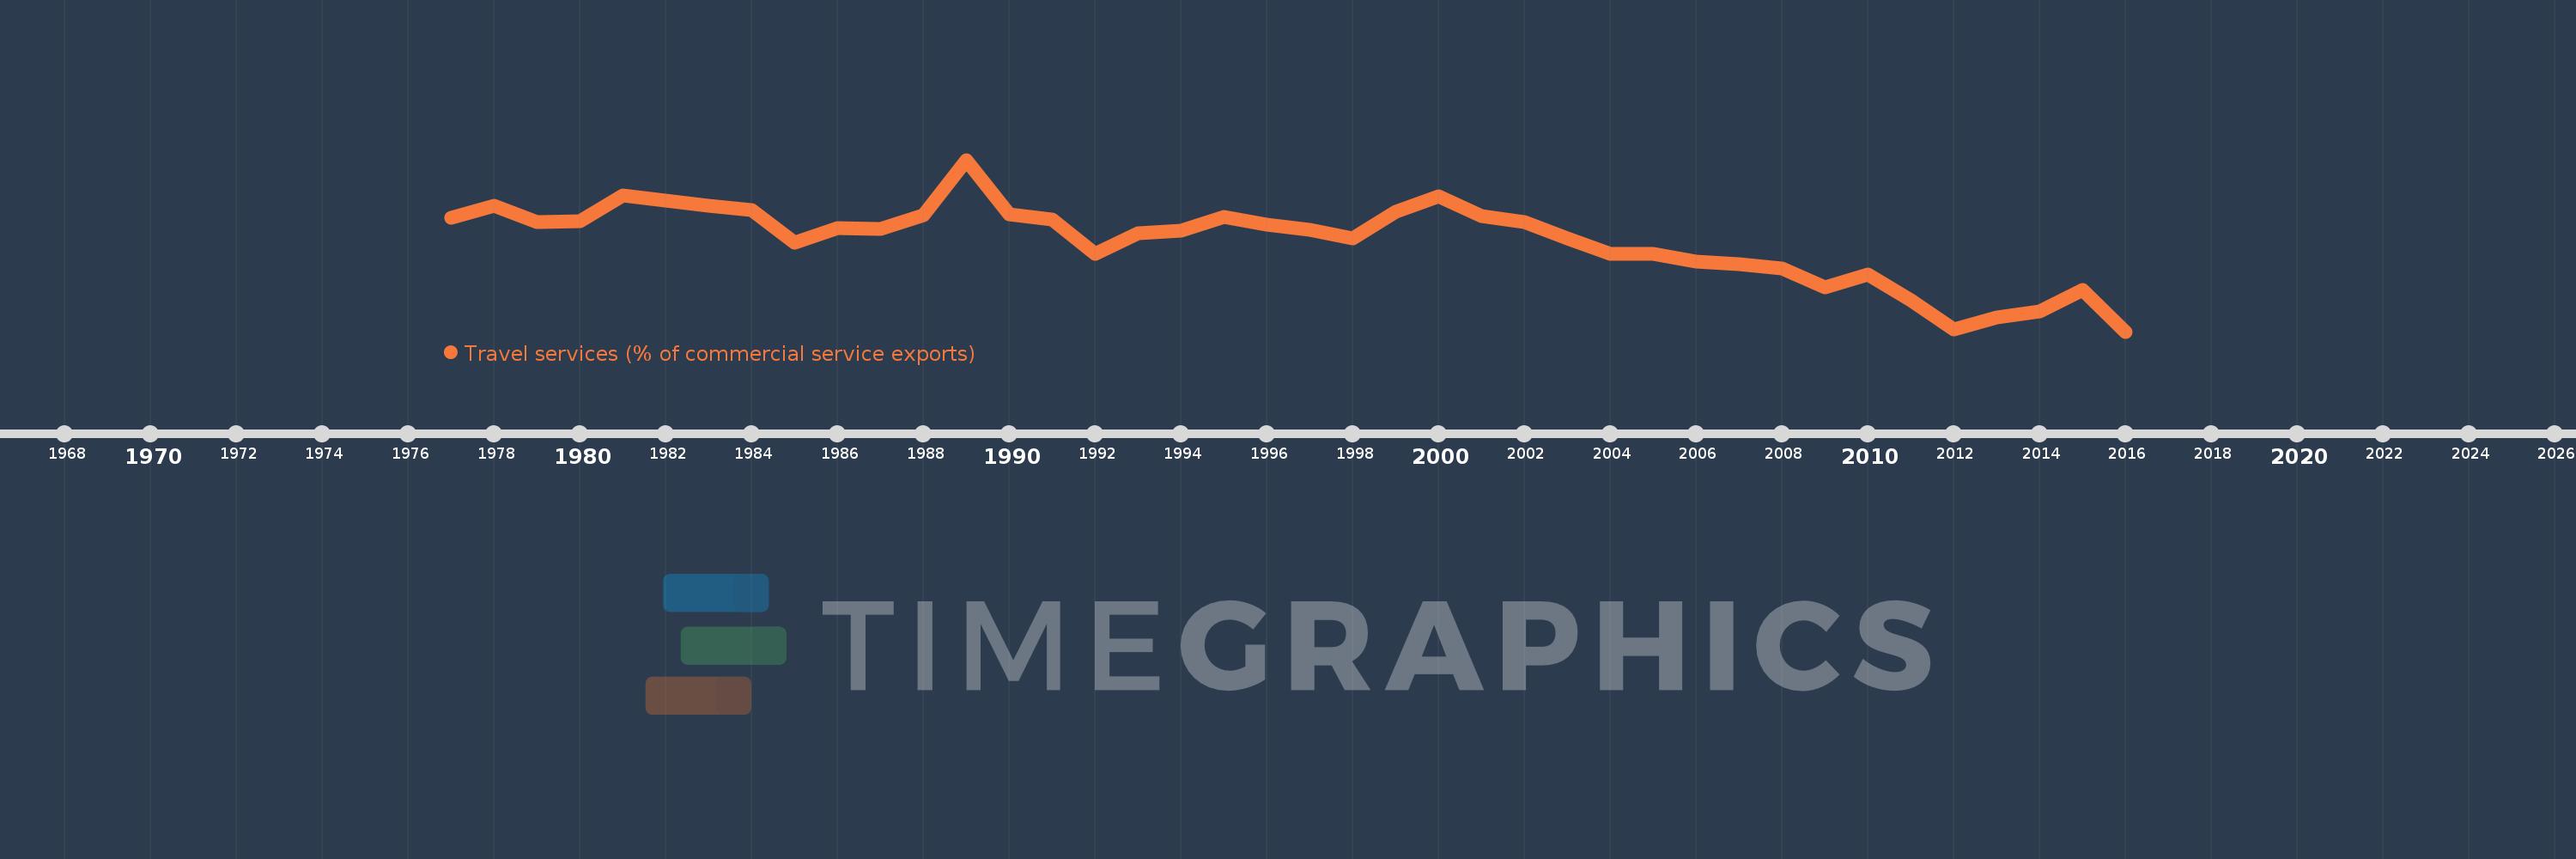
Travel services (% of commercial service exports)
2016,2015,2014,2013,2012,2011,2010,2009,2008,2007,2006,2005,2004,2003,2002,2001,2000,1999,1998,1997,1996,1995,1994,1993,1992,1991,1990,1989,1988,1987,1986,1985,1984,1983,1982,1981,1980,1979,1978,1977
Estas estatísticas em outros países:
AfghanistanAlbaniaAlgeriaAngolaAntigua and BarbudaArab WorldArgentinaArmeniaArubaAustraliaAustriaAzerbaijanBahamas, TheBahrainBangladeshBarbadosBelarusBelgiumBelizeBeninBermudaBhutanBoliviaBosnia and HerzegovinaBotswanaBrazilBrunei DarussalamBulgariaBurkina FasoBurundiCabo VerdeCambodiaCameroonCanadaCaribbean small statesCentral African RepublicCentral Europe and the BalticsChadChileChinaColombiaComorosCongo, Dem. Rep.Congo, Rep.Costa RicaCote d'IvoireCroatiaCuracaoCyprusCzech RepublicDenmarkDjiboutiDominicaDominican RepublicEarly-demographic dividendEast Asia & PacificEast Asia & Pacific (excluding high income)East Asia & Pacific (IDA & IBRD countries)EcuadorEgypt, Arab Rep.El SalvadorEritreaEstoniaEthiopiaEuro areaEurope & Central AsiaEurope & Central Asia (excluding high income)Europe & Central Asia (IDA & IBRD countries)European UnionFaroe IslandsFijiFinlandFragile and conflict affected situationsFranceFrench PolynesiaGabonGambia, TheGeorgiaGermanyGhanaGreeceGrenadaGuatemalaGuineaGuinea-BissauGuyanaHaitiHeavily indebted poor countries (HIPC)High incomeHondurasHong Kong SAR, ChinaHungaryIBRD onlyIcelandIDA & IBRD totalIDA onlyIDA totalIndiaIndonesiaIran, Islamic Rep.IraqIrelandIsraelItalyJamaicaJapanJordanKazakhstanKenyaKiribatiKorea, Rep.KosovoKuwaitKyrgyz RepublicLao PDRLate-demographic dividendLatin America & Caribbean Latin America & Caribbean (excluding high income)Latin America & the Caribbean (IDA & IBRD countries)LatviaLeast developed countries: UN classificationLebanonLesothoLiberiaLibyaLithuaniaLow & middle incomeLow incomeLower middle incomeLuxembourgMacao SAR, ChinaMacedonia, FYRMadagascarMalawiMalaysiaMaldivesMaliMaltaMarshall IslandsMauritaniaMauritiusMexicoMicronesia, Fed. Sts.Middle East & North Africa (excluding high income)Middle East & North Africa (IDA & IBRD countries)Middle incomeMoldovaMongoliaMontenegroMoroccoMozambiqueMyanmarNamibiaNepalNetherlandsNew CaledoniaNew ZealandNicaraguaNigerNigeriaNorth AmericaNorwayOECD membersOmanOther small statesPacific island small statesPakistanPalauPanamaPapua New GuineaParaguayPeruPhilippinesPolandPortugalPost-demographic dividendPre-demographic dividendQatarRomaniaRussian FederationRwandaSamoaSao Tome and PrincipeSaudi ArabiaSenegalSerbiaSeychellesSierra LeoneSingaporeSint Maarten (Dutch part)Slovak RepublicSloveniaSmall statesSolomon IslandsSouth AfricaSouth AsiaSouth Asia (IDA & IBRD)South SudanSpainSri LankaSt. Kitts and NevisSt. LuciaSt. Vincent and the GrenadinesSub-Saharan Africa Sub-Saharan Africa (excluding high income)Sub-Saharan Africa (IDA & IBRD countries)SudanSurinameSwazilandSwedenSwitzerlandSyrian Arab RepublicTajikistanTanzaniaThailandTimor-LesteTogoTongaTrinidad and TobagoTunisiaTurkeyTuvaluUgandaUkraineUnited KingdomUnited StatesUpper middle incomeUruguayVanuatuVenezuela, RBWest Bank and GazaWorldYemen, Rep.ZambiaZimbabwe Linha do tempo:
Nesta escala de tempo está apresentado um gráfico de 1977 ano até 2016 ano Tunisia. Dados de 1976 ano ausente. O número de observações reais por data: 40.
Fonte (nome):
Indicadores de desenvolvimento mundial
Fonte (organização):
International Monetary Fund, Balance of Payments Statistics Yearbook and data files.
Categorias:
Private Sector, Trade
Foi atualizado:
23 abr 2017 ano
Indicadores de alterações dos valores ao longo dos anos
Mínimo:
44.198
1 jan 2016 ano
Máximo:
75.66
1 jan 1989 ano
Na data de observação
Valor
Mudança absoluta
A alteração em relação ao valor anterior
1 jan 1977 ano
65.049
+65.049
0.0%
1 jan 1978 ano
67.29
+2.241
3.45%
1 jan 1979 ano
64.26
-3.03
-4.5%
1 jan 1980 ano
64.474
+0.214
0.33%
1 jan 1981 ano
69.077
+4.604
7.14%
1 jan 1982 ano
68.192
-0.886
-1.28%
1 jan 1983 ano
67.276
-0.916
-1.34%
1 jan 1984 ano
66.4
-0.876
-1.3%
1 jan 1985 ano
60.526
-5.874
-8.85%
1 jan 1986 ano
63.229
+2.703
4.47%
1 jan 1987 ano
62.968
-0.261
-0.41%
1 jan 1988 ano
65.453
+2.484
3.95%
1 jan 1989 ano
75.66
+10.207
15.59%
1 jan 1990 ano
65.741
-9.918
-13.11%
1 jan 1991 ano
64.787
-0.955
-1.45%
1 jan 1992 ano
58.478
-6.309
-9.74%
1 jan 1993 ano
62.193
+3.715
6.35%
1 jan 1994 ano
62.755
+0.562
0.9%
1 jan 1995 ano
65.166
+2.411
3.84%
1 jan 1996 ano
63.716
-1.45
-2.22%
1 jan 1997 ano
62.846
-0.871
-1.37%
1 jan 1998 ano
61.257
-1.589
-2.53%
1 jan 1999 ano
66.164
+4.907
8.01%
1 jan 2000 ano
68.925
+2.761
4.17%
1 jan 2001 ano
65.418
-3.506
-5.09%
1 jan 2002 ano
64.195
-1.224
-1.87%
1 jan 2003 ano
61.238
-2.956
-4.61%
1 jan 2004 ano
58.374
-2.864
-4.68%
1 jan 2005 ano
58.498
+0.124
0.21%
1 jan 2006 ano
57.043
-1.455
-2.49%
1 jan 2007 ano
56.593
-0.451
-0.79%
1 jan 2008 ano
55.738
-0.854
-1.51%
1 jan 2009 ano
52.286
-3.452
-6.19%
1 jan 2010 ano
54.635
+2.349
4.49%
1 jan 2011 ano
49.926
-4.709
-8.62%
1 jan 2012 ano
44.659
-5.267
-10.55%
1 jan 2013 ano
46.836
+2.177
4.87%
1 jan 2014 ano
47.869
+1.033
2.21%
1 jan 2015 ano
51.783
+3.914
8.18%
1 jan 2016 ano
44.198
-7.585
-14.65%
Classificação de países por estatísticas atuais por anos


Comentários: