29
/pt/
pt
AIzaSyAYiBZKx7MnpbEhh9jyipgxe19OcubqV5w
April 1, 2024
213780
Nigeria
NGA
true
2
1
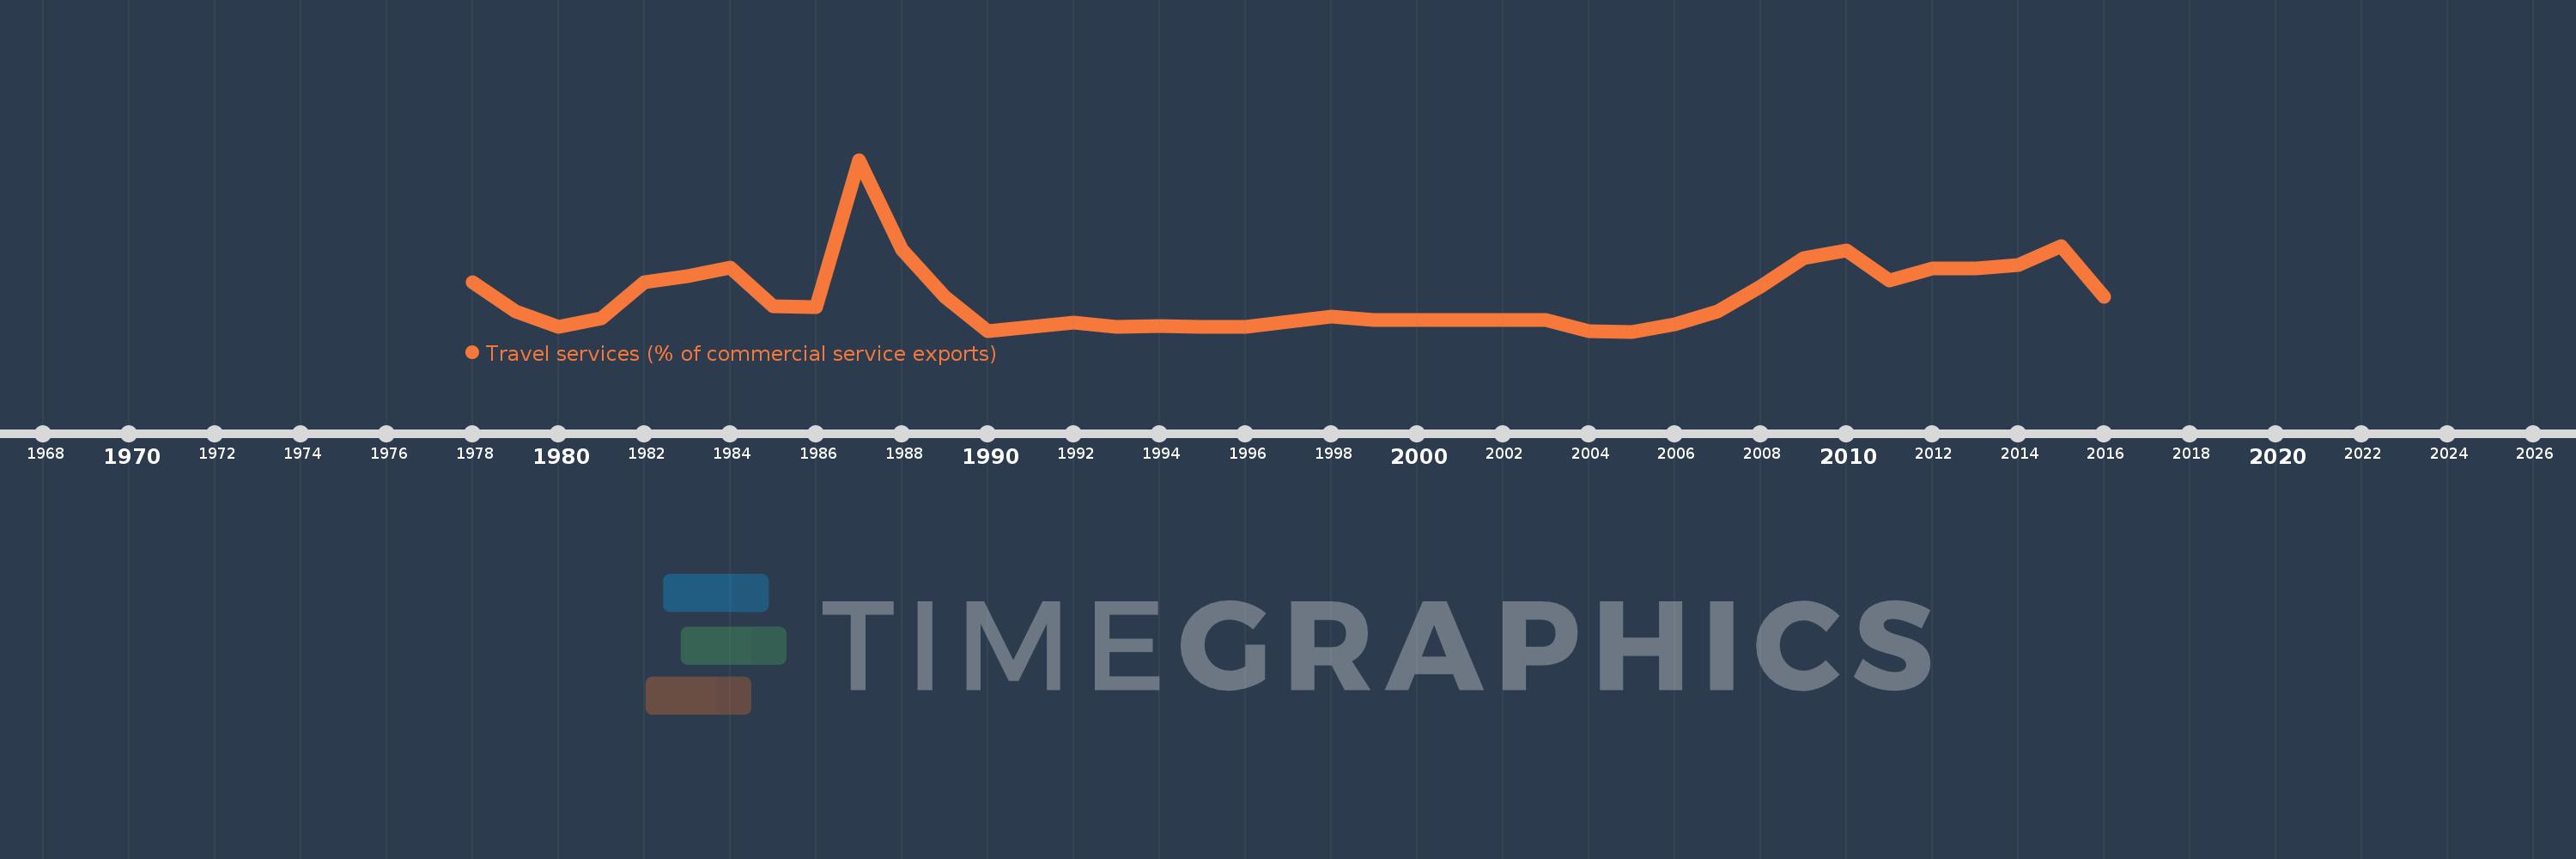
Travel services (% of commercial service exports)
2016,2015,2014,2013,2012,2011,2010,2009,2008,2007,2006,2005,2004,2003,2002,2001,2000,1999,1998,1997,1996,1995,1994,1993,1992,1991,1990,1989,1988,1987,1986,1985,1984,1983,1982,1981,1980,1979,1978
Estas estatísticas em outros países:
AfghanistanAlbaniaAlgeriaAngolaAntigua and BarbudaArab WorldArgentinaArmeniaArubaAustraliaAustriaAzerbaijanBahamas, TheBahrainBangladeshBarbadosBelarusBelgiumBelizeBeninBermudaBhutanBoliviaBosnia and HerzegovinaBotswanaBrazilBrunei DarussalamBulgariaBurkina FasoBurundiCabo VerdeCambodiaCameroonCanadaCaribbean small statesCentral African RepublicCentral Europe and the BalticsChadChileChinaColombiaComorosCongo, Dem. Rep.Congo, Rep.Costa RicaCote d'IvoireCroatiaCuracaoCyprusCzech RepublicDenmarkDjiboutiDominicaDominican RepublicEarly-demographic dividendEast Asia & PacificEast Asia & Pacific (excluding high income)East Asia & Pacific (IDA & IBRD countries)EcuadorEgypt, Arab Rep.El SalvadorEritreaEstoniaEthiopiaEuro areaEurope & Central AsiaEurope & Central Asia (excluding high income)Europe & Central Asia (IDA & IBRD countries)European UnionFaroe IslandsFijiFinlandFragile and conflict affected situationsFranceFrench PolynesiaGabonGambia, TheGeorgiaGermanyGhanaGreeceGrenadaGuatemalaGuineaGuinea-BissauGuyanaHaitiHeavily indebted poor countries (HIPC)High incomeHondurasHong Kong SAR, ChinaHungaryIBRD onlyIcelandIDA & IBRD totalIDA onlyIDA totalIndiaIndonesiaIran, Islamic Rep.IraqIrelandIsraelItalyJamaicaJapanJordanKazakhstanKenyaKiribatiKorea, Rep.KosovoKuwaitKyrgyz RepublicLao PDRLate-demographic dividendLatin America & Caribbean Latin America & Caribbean (excluding high income)Latin America & the Caribbean (IDA & IBRD countries)LatviaLeast developed countries: UN classificationLebanonLesothoLiberiaLibyaLithuaniaLow & middle incomeLow incomeLower middle incomeLuxembourgMacao SAR, ChinaMacedonia, FYRMadagascarMalawiMalaysiaMaldivesMaliMaltaMarshall IslandsMauritaniaMauritiusMexicoMicronesia, Fed. Sts.Middle East & North Africa (excluding high income)Middle East & North Africa (IDA & IBRD countries)Middle incomeMoldovaMongoliaMontenegroMoroccoMozambiqueMyanmarNamibiaNepalNetherlandsNew CaledoniaNew ZealandNicaraguaNigerNigeriaNorth AmericaNorwayOECD membersOmanOther small statesPacific island small statesPakistanPalauPanamaPapua New GuineaParaguayPeruPhilippinesPolandPortugalPost-demographic dividendPre-demographic dividendQatarRomaniaRussian FederationRwandaSamoaSao Tome and PrincipeSaudi ArabiaSenegalSerbiaSeychellesSierra LeoneSingaporeSint Maarten (Dutch part)Slovak RepublicSloveniaSmall statesSolomon IslandsSouth AfricaSouth AsiaSouth Asia (IDA & IBRD)South SudanSpainSri LankaSt. Kitts and NevisSt. LuciaSt. Vincent and the GrenadinesSub-Saharan Africa Sub-Saharan Africa (excluding high income)Sub-Saharan Africa (IDA & IBRD countries)SudanSurinameSwazilandSwedenSwitzerlandSyrian Arab RepublicTajikistanTanzaniaThailandTimor-LesteTogoTongaTrinidad and TobagoTunisiaTurkeyTuvaluUgandaUkraineUnited KingdomUnited StatesUpper middle incomeUruguayVanuatuVenezuela, RBWest Bank and GazaWorldYemen, Rep.ZambiaZimbabwe Linha do tempo:
Nesta escala de tempo está apresentado um gráfico de 1978 ano até 2016 ano Nigeria. Dados de 1977 ano ausente. O número de observações reais por data: 39.
Fonte (nome):
Indicadores de desenvolvimento mundial
Fonte (organização):
International Monetary Fund, Balance of Payments Statistics Yearbook and data files.
Categorias:
Private Sector, Trade
Foi atualizado:
23 abr 2017 ano
Indicadores de alterações dos valores ao longo dos anos
Mínimo:
0.632
1 jan 2005 ano
Máximo:
71.754
1 jan 1987 ano
Na data de observação
Valor
Mudança absoluta
A alteração em relação ao valor anterior
1 jan 1978 ano
21.141
+21.141
0.0%
1 jan 1979 ano
9.156
-11.985
-56.69%
1 jan 1980 ano
2.419
-6.737
-73.58%
1 jan 1981 ano
6.006
+3.587
148.27%
1 jan 1982 ano
20.979
+14.973
249.27%
1 jan 1983 ano
23.684
+2.705
12.89%
1 jan 1984 ano
27.148
+3.464
14.62%
1 jan 1985 ano
11.145
-16.003
-58.95%
1 jan 1986 ano
10.638
-0.506
-4.54%
1 jan 1987 ano
71.754
+61.116
574.49%
1 jan 1988 ano
34.444
-37.31
-52.0%
1 jan 1989 ano
14.909
-19.535
-56.72%
1 jan 1990 ano
0.935
-13.974
-93.73%
1 jan 1991 ano
2.54
+1.605
171.67%
1 jan 1992 ano
4.446
+1.905
75.0%
1 jan 1993 ano
2.748
-1.698
-38.19%
1 jan 1994 ano
2.873
+0.125
4.55%
1 jan 1995 ano
2.684
-0.188
-6.56%
1 jan 1996 ano
2.755
+0.071
2.65%
1 jan 1997 ano
4.827
+2.072
75.18%
1 jan 1998 ano
6.977
+2.15
44.54%
1 jan 1999 ano
5.323
-1.654
-23.71%
1 jan 2000 ano
5.471
+0.148
2.78%
1 jan 2001 ano
5.5
+0.029
0.53%
1 jan 2002 ano
5.5
0.0
0.0%
1 jan 2003 ano
5.5
+0.0
0.0%
1 jan 2004 ano
0.862
-4.638
-84.33%
1 jan 2005 ano
0.632
-0.23
-26.69%
1 jan 2006 ano
3.803
+3.171
501.88%
1 jan 2007 ano
8.956
+5.153
135.5%
1 jan 2008 ano
19.436
+10.48
117.02%
1 jan 2009 ano
31.029
+11.593
59.65%
1 jan 2010 ano
34.198
+3.169
10.21%
1 jan 2011 ano
21.725
-12.473
-36.47%
1 jan 2012 ano
26.932
+5.207
23.97%
1 jan 2013 ano
26.823
-0.109
-0.4%
1 jan 2014 ano
28.072
+1.249
4.66%
1 jan 2015 ano
36.03
+7.958
28.35%
1 jan 2016 ano
15.109
-20.921
-58.07%
Classificação de países por estatísticas atuais por anos


Comentários: