29
/pt/
pt
AIzaSyAYiBZKx7MnpbEhh9jyipgxe19OcubqV5w
April 1, 2024
58620
South Asia (IDA & IBRD)
TSA
false
2
1
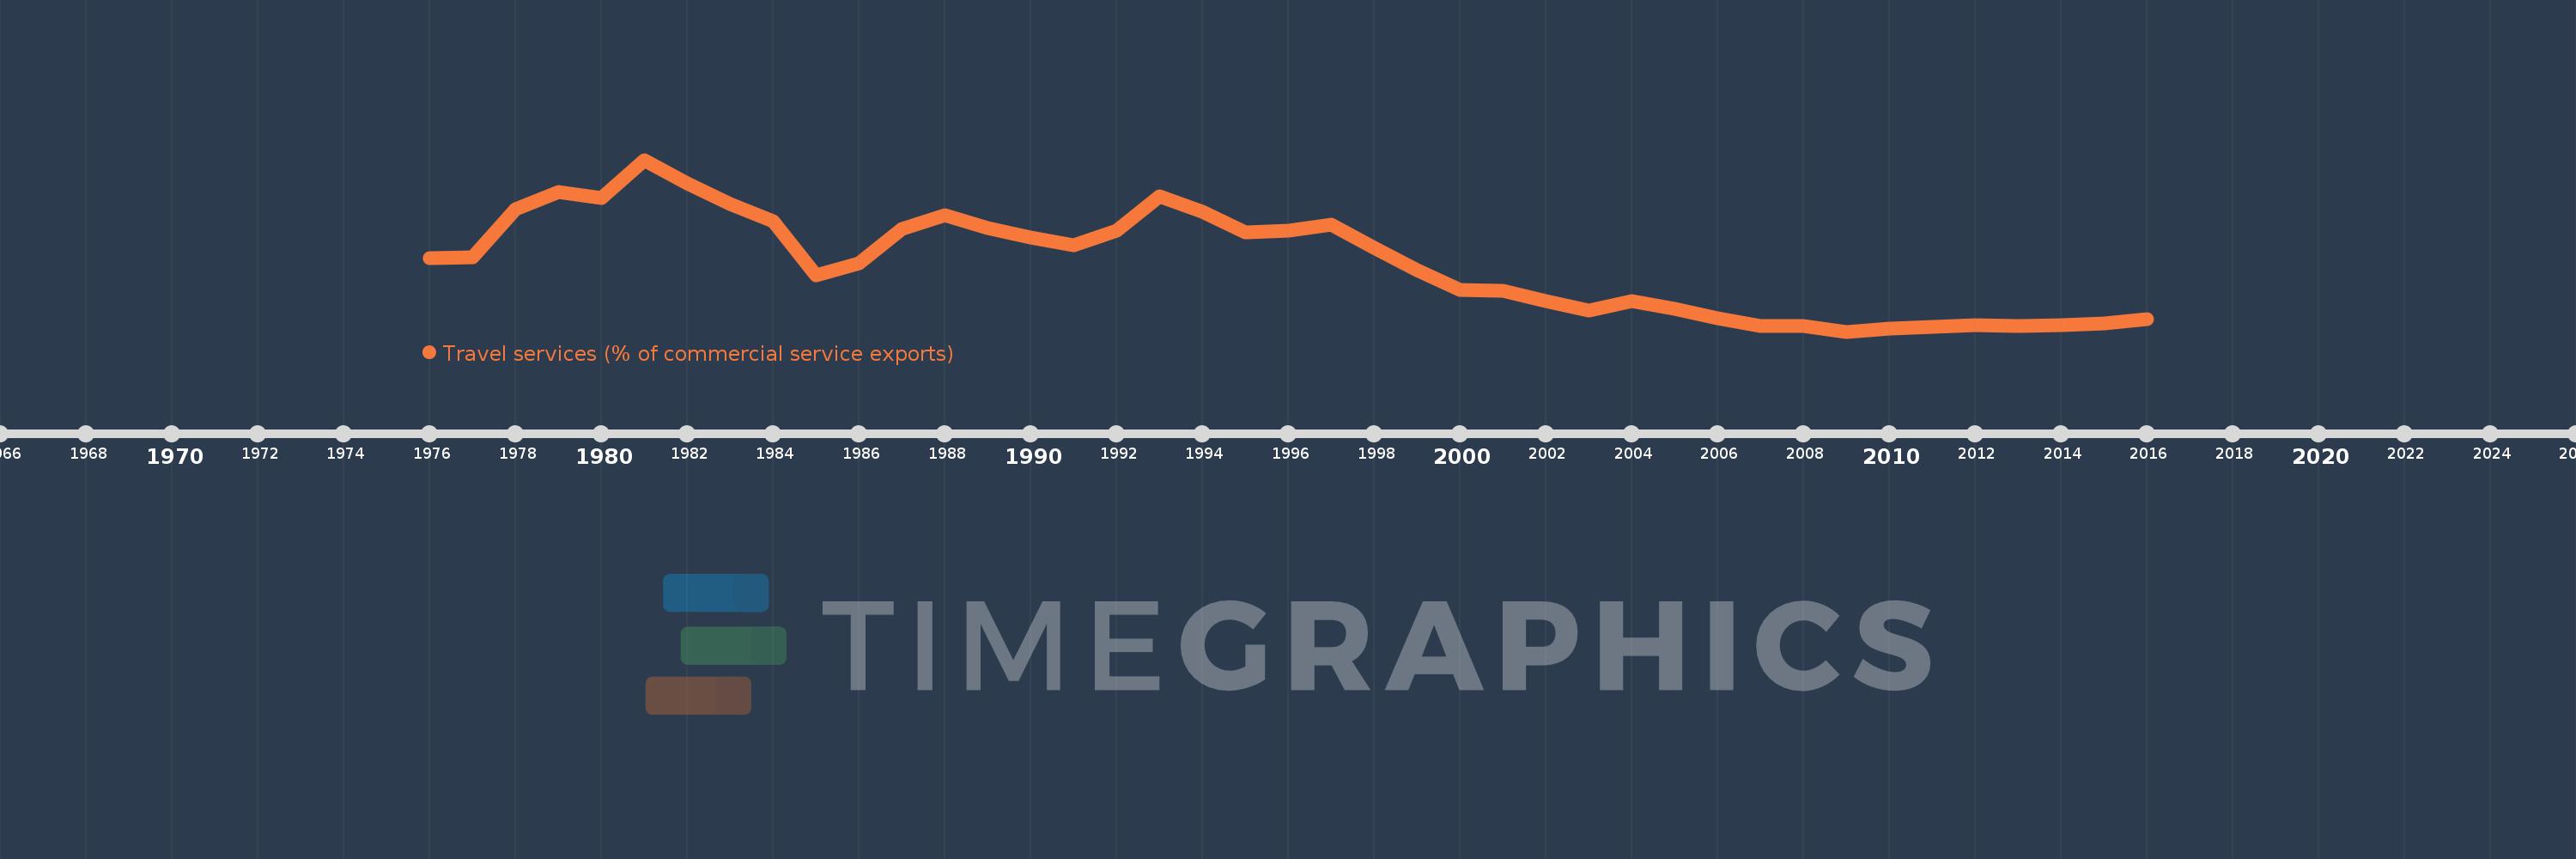
Travel services (% of commercial service exports)
2016,2015,2014,2013,2012,2011,2010,2009,2008,2007,2006,2005,2004,2003,2002,2001,2000,1999,1998,1997,1996,1995,1994,1993,1992,1991,1990,1989,1988,1987,1986,1985,1984,1983,1982,1981,1980,1979,1978,1977,1976
Estas estatísticas em outros países:
AfghanistanAlbaniaAlgeriaAngolaAntigua and BarbudaArab WorldArgentinaArmeniaArubaAustraliaAustriaAzerbaijanBahamas, TheBahrainBangladeshBarbadosBelarusBelgiumBelizeBeninBermudaBhutanBoliviaBosnia and HerzegovinaBotswanaBrazilBrunei DarussalamBulgariaBurkina FasoBurundiCabo VerdeCambodiaCameroonCanadaCaribbean small statesCentral African RepublicCentral Europe and the BalticsChadChileChinaColombiaComorosCongo, Dem. Rep.Congo, Rep.Costa RicaCote d'IvoireCroatiaCuracaoCyprusCzech RepublicDenmarkDjiboutiDominicaDominican RepublicEarly-demographic dividendEast Asia & PacificEast Asia & Pacific (excluding high income)East Asia & Pacific (IDA & IBRD countries)EcuadorEgypt, Arab Rep.El SalvadorEritreaEstoniaEthiopiaEuro areaEurope & Central AsiaEurope & Central Asia (excluding high income)Europe & Central Asia (IDA & IBRD countries)European UnionFaroe IslandsFijiFinlandFragile and conflict affected situationsFranceFrench PolynesiaGabonGambia, TheGeorgiaGermanyGhanaGreeceGrenadaGuatemalaGuineaGuinea-BissauGuyanaHaitiHeavily indebted poor countries (HIPC)High incomeHondurasHong Kong SAR, ChinaHungaryIBRD onlyIcelandIDA & IBRD totalIDA onlyIDA totalIndiaIndonesiaIran, Islamic Rep.IraqIrelandIsraelItalyJamaicaJapanJordanKazakhstanKenyaKiribatiKorea, Rep.KosovoKuwaitKyrgyz RepublicLao PDRLate-demographic dividendLatin America & Caribbean Latin America & Caribbean (excluding high income)Latin America & the Caribbean (IDA & IBRD countries)LatviaLeast developed countries: UN classificationLebanonLesothoLiberiaLibyaLithuaniaLow & middle incomeLow incomeLower middle incomeLuxembourgMacao SAR, ChinaMacedonia, FYRMadagascarMalawiMalaysiaMaldivesMaliMaltaMarshall IslandsMauritaniaMauritiusMexicoMicronesia, Fed. Sts.Middle East & North Africa (excluding high income)Middle East & North Africa (IDA & IBRD countries)Middle incomeMoldovaMongoliaMontenegroMoroccoMozambiqueMyanmarNamibiaNepalNetherlandsNew CaledoniaNew ZealandNicaraguaNigerNigeriaNorth AmericaNorwayOECD membersOmanOther small statesPacific island small statesPakistanPalauPanamaPapua New GuineaParaguayPeruPhilippinesPolandPortugalPost-demographic dividendPre-demographic dividendQatarRomaniaRussian FederationRwandaSamoaSao Tome and PrincipeSaudi ArabiaSenegalSerbiaSeychellesSierra LeoneSingaporeSint Maarten (Dutch part)Slovak RepublicSloveniaSmall statesSolomon IslandsSouth AfricaSouth AsiaSouth Asia (IDA & IBRD)South SudanSpainSri LankaSt. Kitts and NevisSt. LuciaSt. Vincent and the GrenadinesSub-Saharan Africa Sub-Saharan Africa (excluding high income)Sub-Saharan Africa (IDA & IBRD countries)SudanSurinameSwazilandSwedenSwitzerlandSyrian Arab RepublicTajikistanTanzaniaThailandTimor-LesteTogoTongaTrinidad and TobagoTunisiaTurkeyTuvaluUgandaUkraineUnited KingdomUnited StatesUpper middle incomeUruguayVanuatuVenezuela, RBWest Bank and GazaWorldYemen, Rep.ZambiaZimbabwe Linha do tempo:
Nesta escala de tempo está apresentado um gráfico de 1976 ano até 2016 ano South Asia (IDA & IBRD). Dados de 1975 ano ausente. O número de observações reais por data: 41.
Fonte (nome):
Indicadores de desenvolvimento mundial
Fonte (organização):
International Monetary Fund, Balance of Payments Statistics Yearbook and data files.
Categorias:
Private Sector, Trade
Foi atualizado:
23 abr 2017 ano
Indicadores de alterações dos valores ao longo dos anos
Mínimo:
11.545
1 jan 2009 ano
Máximo:
48.596
1 jan 1981 ano
Na data de observação
Valor
Mudança absoluta
A alteração em relação ao valor anterior
1 jan 1976 ano
27.349
+27.349
0.0%
1 jan 1977 ano
27.54
+0.191
0.7%
1 jan 1978 ano
37.934
+10.394
37.74%
1 jan 1979 ano
41.738
+3.804
10.03%
1 jan 1980 ano
40.363
-1.375
-3.3%
1 jan 1981 ano
48.596
+8.233
20.4%
1 jan 1982 ano
43.42
-5.176
-10.65%
1 jan 1983 ano
39.115
-4.305
-9.92%
1 jan 1984 ano
35.325
-3.789
-9.69%
1 jan 1985 ano
23.673
-11.653
-32.99%
1 jan 1986 ano
26.311
+2.639
11.15%
1 jan 1987 ano
33.742
+7.431
28.24%
1 jan 1988 ano
36.636
+2.894
8.58%
1 jan 1989 ano
33.835
-2.801
-7.65%
1 jan 1990 ano
31.786
-2.049
-6.06%
1 jan 1991 ano
30.245
-1.541
-4.85%
1 jan 1992 ano
33.299
+3.054
10.1%
1 jan 1993 ano
40.727
+7.427
22.3%
1 jan 1994 ano
37.422
-3.305
-8.12%
1 jan 1995 ano
32.995
-4.426
-11.83%
1 jan 1996 ano
33.235
+0.239
0.72%
1 jan 1997 ano
34.674
+1.44
4.33%
1 jan 1998 ano
29.552
-5.122
-14.77%
1 jan 1999 ano
24.782
-4.771
-16.14%
1 jan 2000 ano
20.44
-4.341
-17.52%
1 jan 2001 ano
20.424
-0.016
-0.08%
1 jan 2002 ano
18.18
-2.245
-10.99%
1 jan 2003 ano
16.056
-2.124
-11.68%
1 jan 2004 ano
18.153
+2.098
13.07%
1 jan 2005 ano
16.481
-1.672
-9.21%
1 jan 2006 ano
14.408
-2.073
-12.58%
1 jan 2007 ano
12.827
-1.581
-10.97%
1 jan 2008 ano
12.709
-0.118
-0.92%
1 jan 2009 ano
11.545
-1.164
-9.16%
1 jan 2010 ano
12.189
+0.644
5.58%
1 jan 2011 ano
12.51
+0.321
2.64%
1 jan 2012 ano
12.92
+0.41
3.27%
1 jan 2013 ano
12.659
-0.261
-2.02%
1 jan 2014 ano
12.866
+0.208
1.64%
1 jan 2015 ano
13.232
+0.366
2.85%
1 jan 2016 ano
14.197
+0.965
7.29%
Classificação de países por estatísticas atuais por anos


Comentários: