29
/pt/
pt
AIzaSyAYiBZKx7MnpbEhh9jyipgxe19OcubqV5w
April 1, 2024
134696
France
FRA
true
2
1
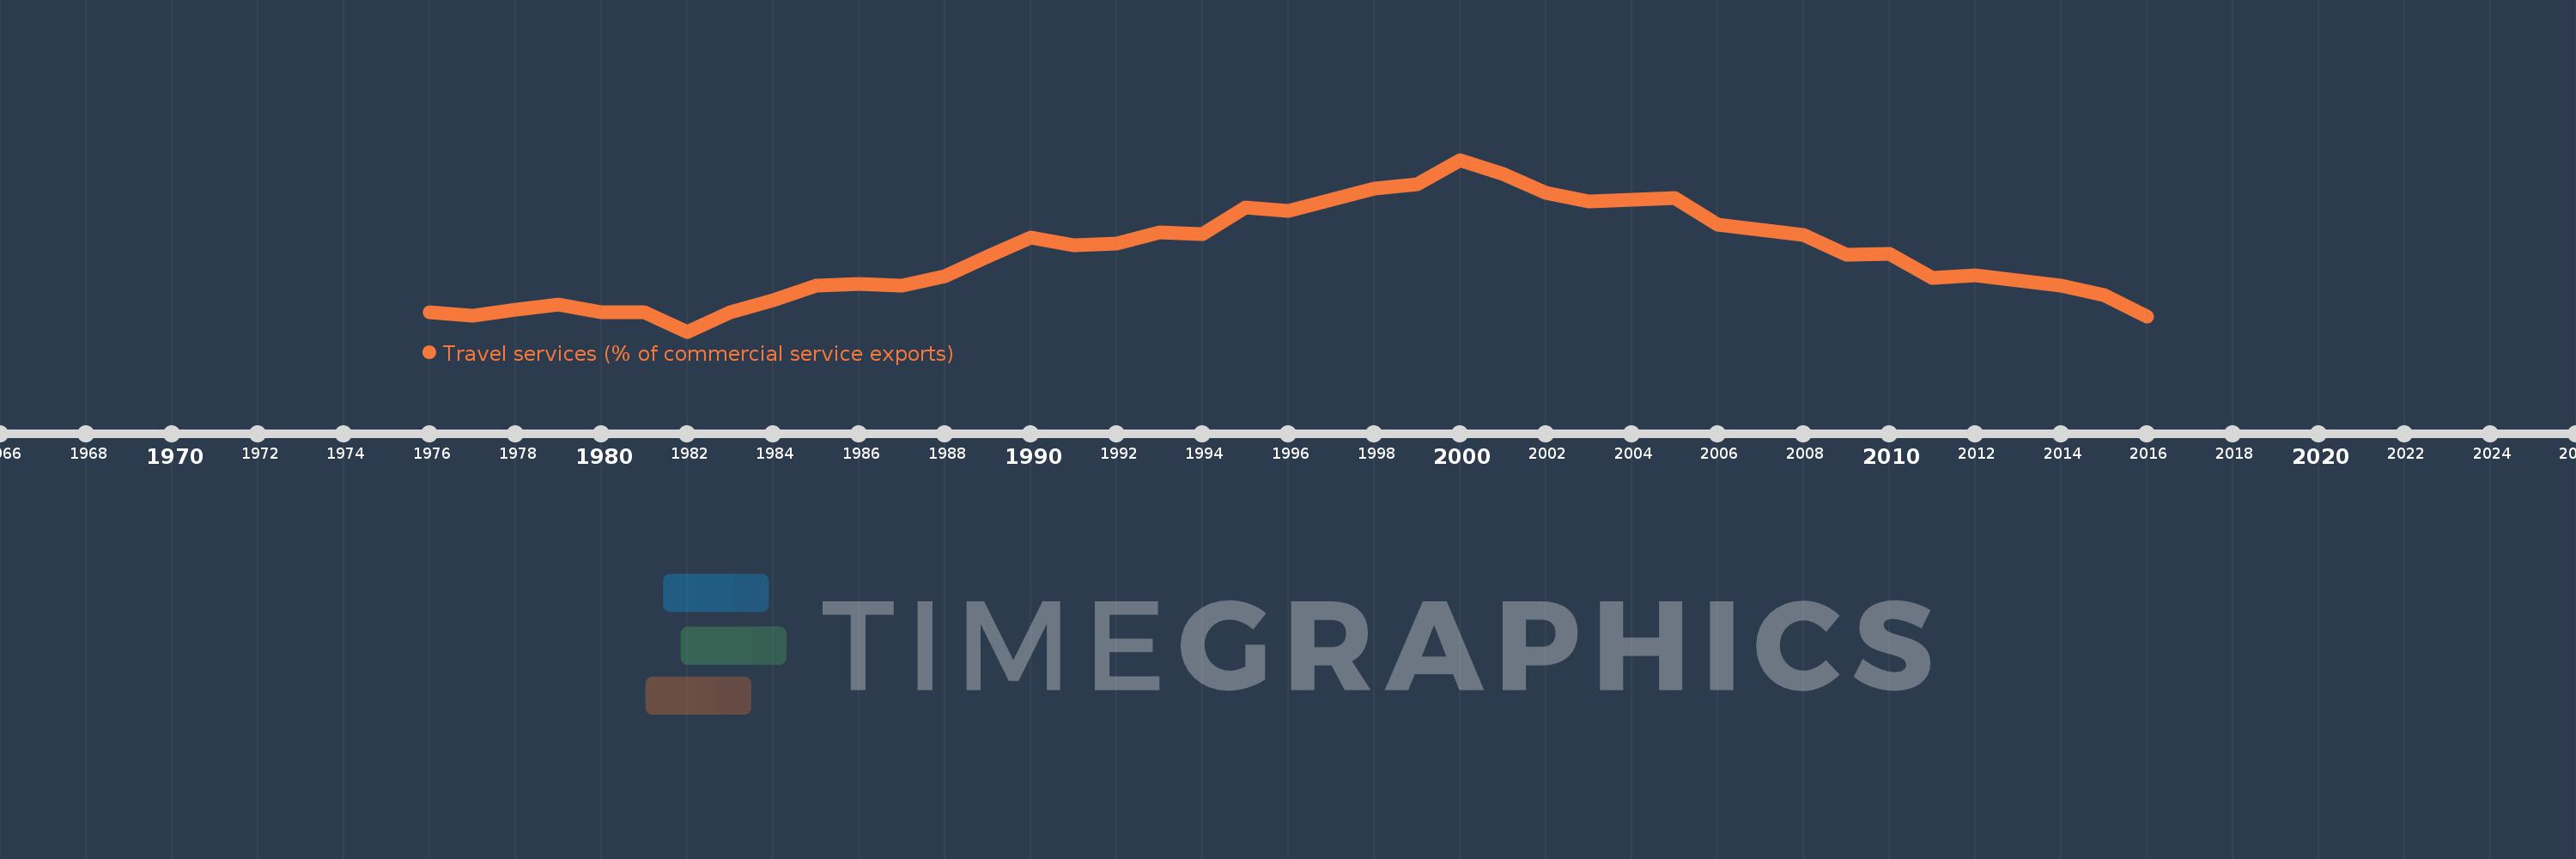
Travel services (% of commercial service exports)
2016,2015,2014,2013,2012,2011,2010,2009,2008,2007,2006,2005,2004,2003,2002,2001,2000,1999,1998,1997,1996,1995,1994,1993,1992,1991,1990,1989,1988,1987,1986,1985,1984,1983,1982,1981,1980,1979,1978,1977,1976
Estas estatísticas em outros países:
AfghanistanAlbaniaAlgeriaAngolaAntigua and BarbudaArab WorldArgentinaArmeniaArubaAustraliaAustriaAzerbaijanBahamas, TheBahrainBangladeshBarbadosBelarusBelgiumBelizeBeninBermudaBhutanBoliviaBosnia and HerzegovinaBotswanaBrazilBrunei DarussalamBulgariaBurkina FasoBurundiCabo VerdeCambodiaCameroonCanadaCaribbean small statesCentral African RepublicCentral Europe and the BalticsChadChileChinaColombiaComorosCongo, Dem. Rep.Congo, Rep.Costa RicaCote d'IvoireCroatiaCuracaoCyprusCzech RepublicDenmarkDjiboutiDominicaDominican RepublicEarly-demographic dividendEast Asia & PacificEast Asia & Pacific (excluding high income)East Asia & Pacific (IDA & IBRD countries)EcuadorEgypt, Arab Rep.El SalvadorEritreaEstoniaEthiopiaEuro areaEurope & Central AsiaEurope & Central Asia (excluding high income)Europe & Central Asia (IDA & IBRD countries)European UnionFaroe IslandsFijiFinlandFragile and conflict affected situationsFranceFrench PolynesiaGabonGambia, TheGeorgiaGermanyGhanaGreeceGrenadaGuatemalaGuineaGuinea-BissauGuyanaHaitiHeavily indebted poor countries (HIPC)High incomeHondurasHong Kong SAR, ChinaHungaryIBRD onlyIcelandIDA & IBRD totalIDA onlyIDA totalIndiaIndonesiaIran, Islamic Rep.IraqIrelandIsraelItalyJamaicaJapanJordanKazakhstanKenyaKiribatiKorea, Rep.KosovoKuwaitKyrgyz RepublicLao PDRLate-demographic dividendLatin America & Caribbean Latin America & Caribbean (excluding high income)Latin America & the Caribbean (IDA & IBRD countries)LatviaLeast developed countries: UN classificationLebanonLesothoLiberiaLibyaLithuaniaLow & middle incomeLow incomeLower middle incomeLuxembourgMacao SAR, ChinaMacedonia, FYRMadagascarMalawiMalaysiaMaldivesMaliMaltaMarshall IslandsMauritaniaMauritiusMexicoMicronesia, Fed. Sts.Middle East & North Africa (excluding high income)Middle East & North Africa (IDA & IBRD countries)Middle incomeMoldovaMongoliaMontenegroMoroccoMozambiqueMyanmarNamibiaNepalNetherlandsNew CaledoniaNew ZealandNicaraguaNigerNigeriaNorth AmericaNorwayOECD membersOmanOther small statesPacific island small statesPakistanPalauPanamaPapua New GuineaParaguayPeruPhilippinesPolandPortugalPost-demographic dividendPre-demographic dividendQatarRomaniaRussian FederationRwandaSamoaSao Tome and PrincipeSaudi ArabiaSenegalSerbiaSeychellesSierra LeoneSingaporeSint Maarten (Dutch part)Slovak RepublicSloveniaSmall statesSolomon IslandsSouth AfricaSouth AsiaSouth Asia (IDA & IBRD)South SudanSpainSri LankaSt. Kitts and NevisSt. LuciaSt. Vincent and the GrenadinesSub-Saharan Africa Sub-Saharan Africa (excluding high income)Sub-Saharan Africa (IDA & IBRD countries)SudanSurinameSwazilandSwedenSwitzerlandSyrian Arab RepublicTajikistanTanzaniaThailandTimor-LesteTogoTongaTrinidad and TobagoTunisiaTurkeyTuvaluUgandaUkraineUnited KingdomUnited StatesUpper middle incomeUruguayVanuatuVenezuela, RBWest Bank and GazaWorldYemen, Rep.ZambiaZimbabwe Linha do tempo:
Nesta escala de tempo está apresentado um gráfico de 1976 ano até 2016 ano France. Dados de 1975 ano ausente. O número de observações reais por data: 41.
Fonte (nome):
Indicadores de desenvolvimento mundial
Fonte (organização):
International Monetary Fund, Balance of Payments Statistics Yearbook and data files.
Categorias:
Private Sector, Trade
Foi atualizado:
23 abr 2017 ano
Indicadores de alterações dos valores ao longo dos anos
Mínimo:
17.459
1 jan 1982 ano
Máximo:
35.68
1 jan 2000 ano
Na data de observação
Valor
Mudança absoluta
A alteração em relação ao valor anterior
1 jan 1976 ano
19.476
+19.476
0.0%
1 jan 1977 ano
19.11
-0.367
-1.88%
1 jan 1978 ano
19.753
+0.643
3.36%
1 jan 1979 ano
20.341
+0.588
2.98%
1 jan 1980 ano
19.488
-0.853
-4.19%
1 jan 1981 ano
19.482
-0.007
-0.03%
1 jan 1982 ano
17.459
-2.023
-10.38%
1 jan 1983 ano
19.47
+2.011
11.52%
1 jan 1984 ano
20.828
+1.358
6.97%
1 jan 1985 ano
22.374
+1.546
7.42%
1 jan 1986 ano
22.482
+0.108
0.48%
1 jan 1987 ano
22.335
-0.147
-0.66%
1 jan 1988 ano
23.293
+0.959
4.29%
1 jan 1989 ano
25.41
+2.117
9.09%
1 jan 1990 ano
27.394
+1.984
7.81%
1 jan 1991 ano
26.615
-0.779
-2.84%
1 jan 1992 ano
26.765
+0.149
0.56%
1 jan 1993 ano
28.017
+1.252
4.68%
1 jan 1994 ano
27.769
-0.248
-0.88%
1 jan 1995 ano
30.616
+2.848
10.25%
1 jan 1996 ano
30.269
-0.348
-1.14%
1 jan 1997 ano
31.465
+1.197
3.95%
1 jan 1998 ano
32.658
+1.192
3.79%
1 jan 1999 ano
33.041
+0.383
1.17%
1 jan 2000 ano
35.68
+2.639
7.99%
1 jan 2001 ano
34.163
-1.517
-4.25%
1 jan 2002 ano
32.213
-1.95
-5.71%
1 jan 2003 ano
31.25
-0.963
-2.99%
1 jan 2004 ano
31.454
+0.204
0.65%
1 jan 2005 ano
31.631
+0.176
0.56%
1 jan 2006 ano
28.834
-2.797
-8.84%
1 jan 2007 ano
28.263
-0.57
-1.98%
1 jan 2008 ano
27.69
-0.574
-2.03%
1 jan 2009 ano
25.649
-2.041
-7.37%
1 jan 2010 ano
25.712
+0.062
0.24%
1 jan 2011 ano
23.152
-2.559
-9.95%
1 jan 2012 ano
23.405
+0.253
1.09%
1 jan 2013 ano
22.852
-0.553
-2.36%
1 jan 2014 ano
22.304
-0.547
-2.4%
1 jan 2015 ano
21.336
-0.968
-4.34%
1 jan 2016 ano
19.064
-2.272
-10.65%
Classificação de países por estatísticas atuais por anos


Comentários: