29
/pt/
pt
AIzaSyAYiBZKx7MnpbEhh9jyipgxe19OcubqV5w
April 1, 2024
83691
Benin
BEN
true
2
1
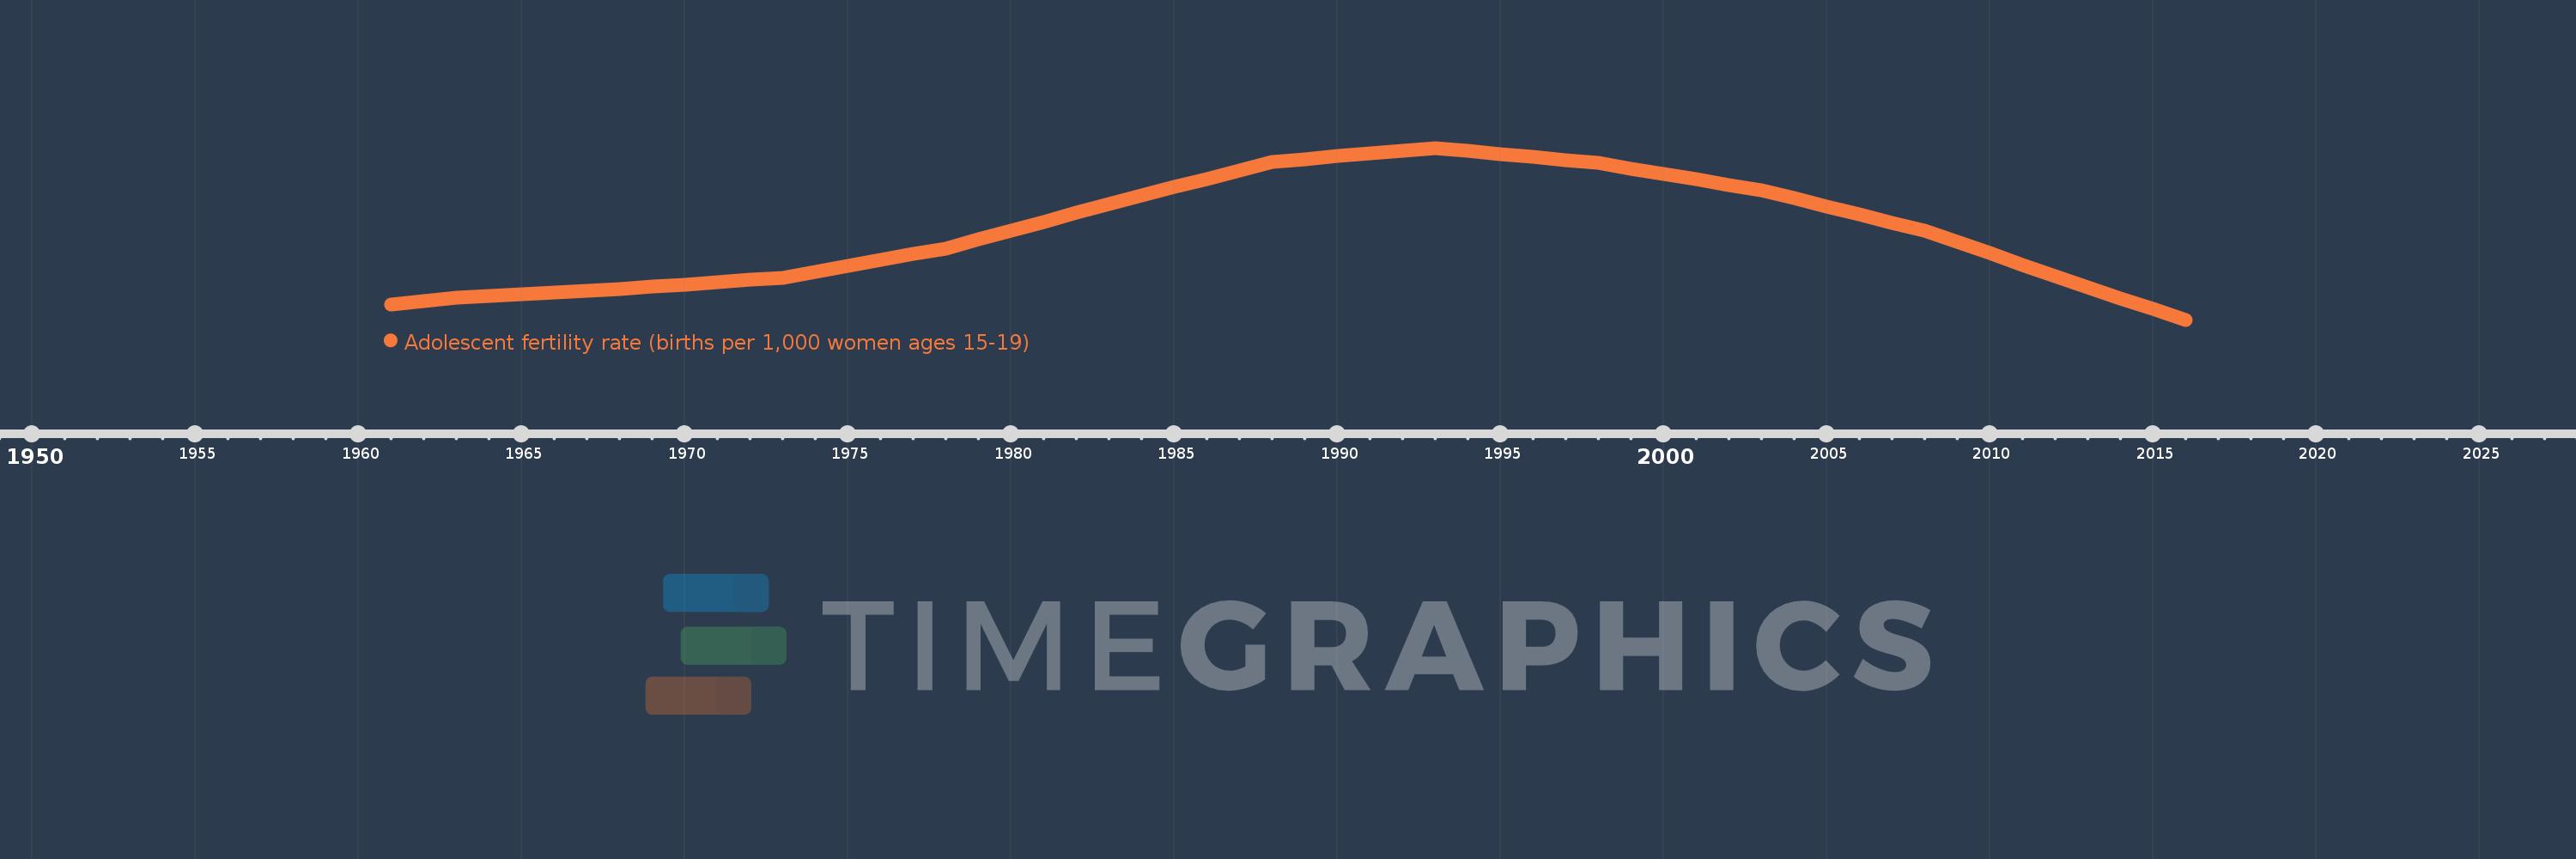
Adolescent fertility rate (births per 1,000 women ages 15-19)
2016,2015,2014,2013,2012,2011,2010,2009,2008,2007,2006,2005,2004,2003,2002,2001,2000,1999,1998,1997,1996,1995,1994,1993,1992,1991,1990,1989,1988,1987,1986,1985,1984,1983,1982,1981,1980,1979,1978,1977,1976,1975,1974,1973,1972,1971,1970,1969,1968,1967,1966,1965,1964,1963,1962,1961
Estas estatísticas em outros países:
AfghanistanAlbaniaAlgeriaAngolaAntigua and BarbudaArab WorldArgentinaArmeniaArubaAustraliaAustriaAzerbaijanBahamas, TheBahrainBangladeshBarbadosBelarusBelgiumBelizeBeninBhutanBoliviaBosnia and HerzegovinaBotswanaBrazilBrunei DarussalamBulgariaBurkina FasoBurundiCabo VerdeCambodiaCameroonCanadaCaribbean small statesCentral African RepublicCentral Europe and the BalticsChadChannel IslandsChileChinaColombiaComorosCongo, Dem. Rep.Congo, Rep.Costa RicaCote d'IvoireCroatiaCubaCuracaoCyprusCzech RepublicDenmarkDjiboutiDominican RepublicEarly-demographic dividendEast Asia & PacificEast Asia & Pacific (excluding high income)East Asia & Pacific (IDA & IBRD countries)EcuadorEgypt, Arab Rep.El SalvadorEquatorial GuineaEritreaEstoniaEthiopiaEuro areaEurope & Central AsiaEurope & Central Asia (excluding high income)Europe & Central Asia (IDA & IBRD countries)European UnionFijiFinlandFragile and conflict affected situationsFranceFrench PolynesiaGabonGambia, TheGeorgiaGermanyGhanaGreeceGrenadaGuamGuatemalaGuineaGuinea-BissauGuyanaHaitiHeavily indebted poor countries (HIPC)High incomeHondurasHong Kong SAR, ChinaHungaryIBRD onlyIcelandIDA & IBRD totalIDA blendIDA onlyIDA totalIndiaIndonesiaIran, Islamic Rep.IraqIrelandIsraelItalyJamaicaJapanJordanKazakhstanKenyaKiribatiKorea, Dem. People’s Rep.Korea, Rep.KuwaitKyrgyz RepublicLao PDRLate-demographic dividendLatin America & Caribbean Latin America & Caribbean (excluding high income)Latin America & the Caribbean (IDA & IBRD countries)LatviaLeast developed countries: UN classificationLebanonLesothoLiberiaLibyaLithuaniaLow & middle incomeLow incomeLower middle incomeLuxembourgMacao SAR, ChinaMacedonia, FYRMadagascarMalawiMalaysiaMaldivesMaliMaltaMauritaniaMauritiusMexicoMicronesia, Fed. Sts.Middle East & North AfricaMiddle East & North Africa (excluding high income)Middle East & North Africa (IDA & IBRD countries)Middle incomeMoldovaMongoliaMontenegroMoroccoMozambiqueMyanmarNamibiaNepalNetherlandsNew CaledoniaNew ZealandNicaraguaNigerNigeriaNorth AmericaNorwayOECD membersOmanOther small statesPacific island small statesPakistanPanamaPapua New GuineaParaguayPeruPhilippinesPolandPortugalPost-demographic dividendPre-demographic dividendPuerto RicoQatarRomaniaRussian FederationRwandaSamoaSao Tome and PrincipeSaudi ArabiaSenegalSerbiaSeychellesSierra LeoneSingaporeSlovak RepublicSloveniaSmall statesSolomon IslandsSomaliaSouth AfricaSouth AsiaSouth Asia (IDA & IBRD)South SudanSpainSri LankaSt. LuciaSt. Vincent and the GrenadinesSub-Saharan Africa Sub-Saharan Africa (excluding high income)Sub-Saharan Africa (IDA & IBRD countries)SudanSurinameSwazilandSwedenSwitzerlandSyrian Arab RepublicTajikistanTanzaniaThailandTimor-LesteTogoTongaTrinidad and TobagoTunisiaTurkeyTurkmenistanUgandaUkraineUnited Arab EmiratesUnited KingdomUnited StatesUpper middle incomeUruguayUzbekistanVanuatuVenezuela, RBVietnamVirgin Islands (U.S.)West Bank and GazaWorldYemen, Rep.ZambiaZimbabwe Linha do tempo:
Nesta escala de tempo está apresentado um gráfico de 1961 ano até 2016 ano Benin. Dados de 1960 ano ausente. O número de observações reais por data: 56.
Fonte (nome):
Indicadores de desenvolvimento mundial
Fonte (organização):
United Nations Population Division, World Population Prospects.
Categorias:
Health, Gender, Social Development
Foi atualizado:
23 abr 2017 ano
Indicadores de alterações dos valores ao longo dos anos
Mínimo:
81.775
1 jan 2016 ano
Máximo:
126.766
1 jan 1993 ano
Na data de observação
Valor
Mudança absoluta
A alteração em relação ao valor anterior
1 jan 1961 ano
85.763
+85.763
0.0%
1 jan 1962 ano
86.685
+0.923
1.08%
1 jan 1963 ano
87.608
+0.923
1.06%
1 jan 1964 ano
88.058
+0.45
0.51%
1 jan 1965 ano
88.507
+0.45
0.51%
1 jan 1966 ano
88.957
+0.45
0.51%
1 jan 1967 ano
89.406
+0.45
0.51%
1 jan 1968 ano
89.856
+0.45
0.5%
1 jan 1969 ano
90.437
+0.581
0.65%
1 jan 1970 ano
91.019
+0.581
0.64%
1 jan 1971 ano
91.6
+0.581
0.64%
1 jan 1972 ano
92.182
+0.581
0.63%
1 jan 1973 ano
92.763
+0.581
0.63%
1 jan 1974 ano
94.306
+1.543
1.66%
1 jan 1975 ano
95.85
+1.543
1.64%
1 jan 1976 ano
97.393
+1.543
1.61%
1 jan 1977 ano
98.937
+1.543
1.58%
1 jan 1978 ano
100.48
+1.543
1.56%
1 jan 1979 ano
102.795
+2.315
2.3%
1 jan 1980 ano
105.11
+2.315
2.25%
1 jan 1981 ano
107.425
+2.315
2.2%
1 jan 1982 ano
109.74
+2.315
2.15%
1 jan 1983 ano
112.055
+2.315
2.11%
1 jan 1984 ano
114.264
+2.209
1.97%
1 jan 1985 ano
116.473
+2.209
1.93%
1 jan 1986 ano
118.682
+2.209
1.9%
1 jan 1987 ano
120.891
+2.209
1.86%
1 jan 1988 ano
123.1
+2.209
1.83%
1 jan 1989 ano
123.833
+0.733
0.6%
1 jan 1990 ano
124.566
+0.733
0.59%
1 jan 1991 ano
125.3
+0.733
0.59%
1 jan 1992 ano
126.033
+0.733
0.59%
1 jan 1993 ano
126.766
+0.733
0.58%
1 jan 1994 ano
125.977
-0.789
-0.62%
1 jan 1995 ano
125.189
-0.789
-0.63%
1 jan 1996 ano
124.4
-0.789
-0.63%
1 jan 1997 ano
123.612
-0.789
-0.63%
1 jan 1998 ano
122.823
-0.789
-0.64%
1 jan 1999 ano
121.39
-1.433
-1.17%
1 jan 2000 ano
119.957
-1.433
-1.18%
1 jan 2001 ano
118.525
-1.433
-1.19%
1 jan 2002 ano
117.092
-1.433
-1.21%
1 jan 2003 ano
115.659
-1.433
-1.22%
1 jan 2004 ano
113.547
-2.112
-1.83%
1 jan 2005 ano
111.436
-2.112
-1.86%
1 jan 2006 ano
109.324
-2.112
-1.89%
1 jan 2007 ano
107.213
-2.112
-1.93%
1 jan 2008 ano
105.101
-2.112
-1.97%
1 jan 2009 ano
102.125
-2.976
-2.83%
1 jan 2010 ano
99.149
-2.976
-2.91%
1 jan 2011 ano
96.172
-2.976
-3.0%
1 jan 2012 ano
93.196
-2.976
-3.09%
1 jan 2013 ano
90.22
-2.976
-3.19%
1 jan 2014 ano
87.405
-2.815
-3.12%
1 jan 2015 ano
84.59
-2.815
-3.22%
1 jan 2016 ano
81.775
-2.815
-3.33%
Classificação de países por estatísticas atuais por anos


Comentários: