29
/pt/
pt
AIzaSyAYiBZKx7MnpbEhh9jyipgxe19OcubqV5w
April 1, 2024
53195
Other small states
OSS
false
2
1
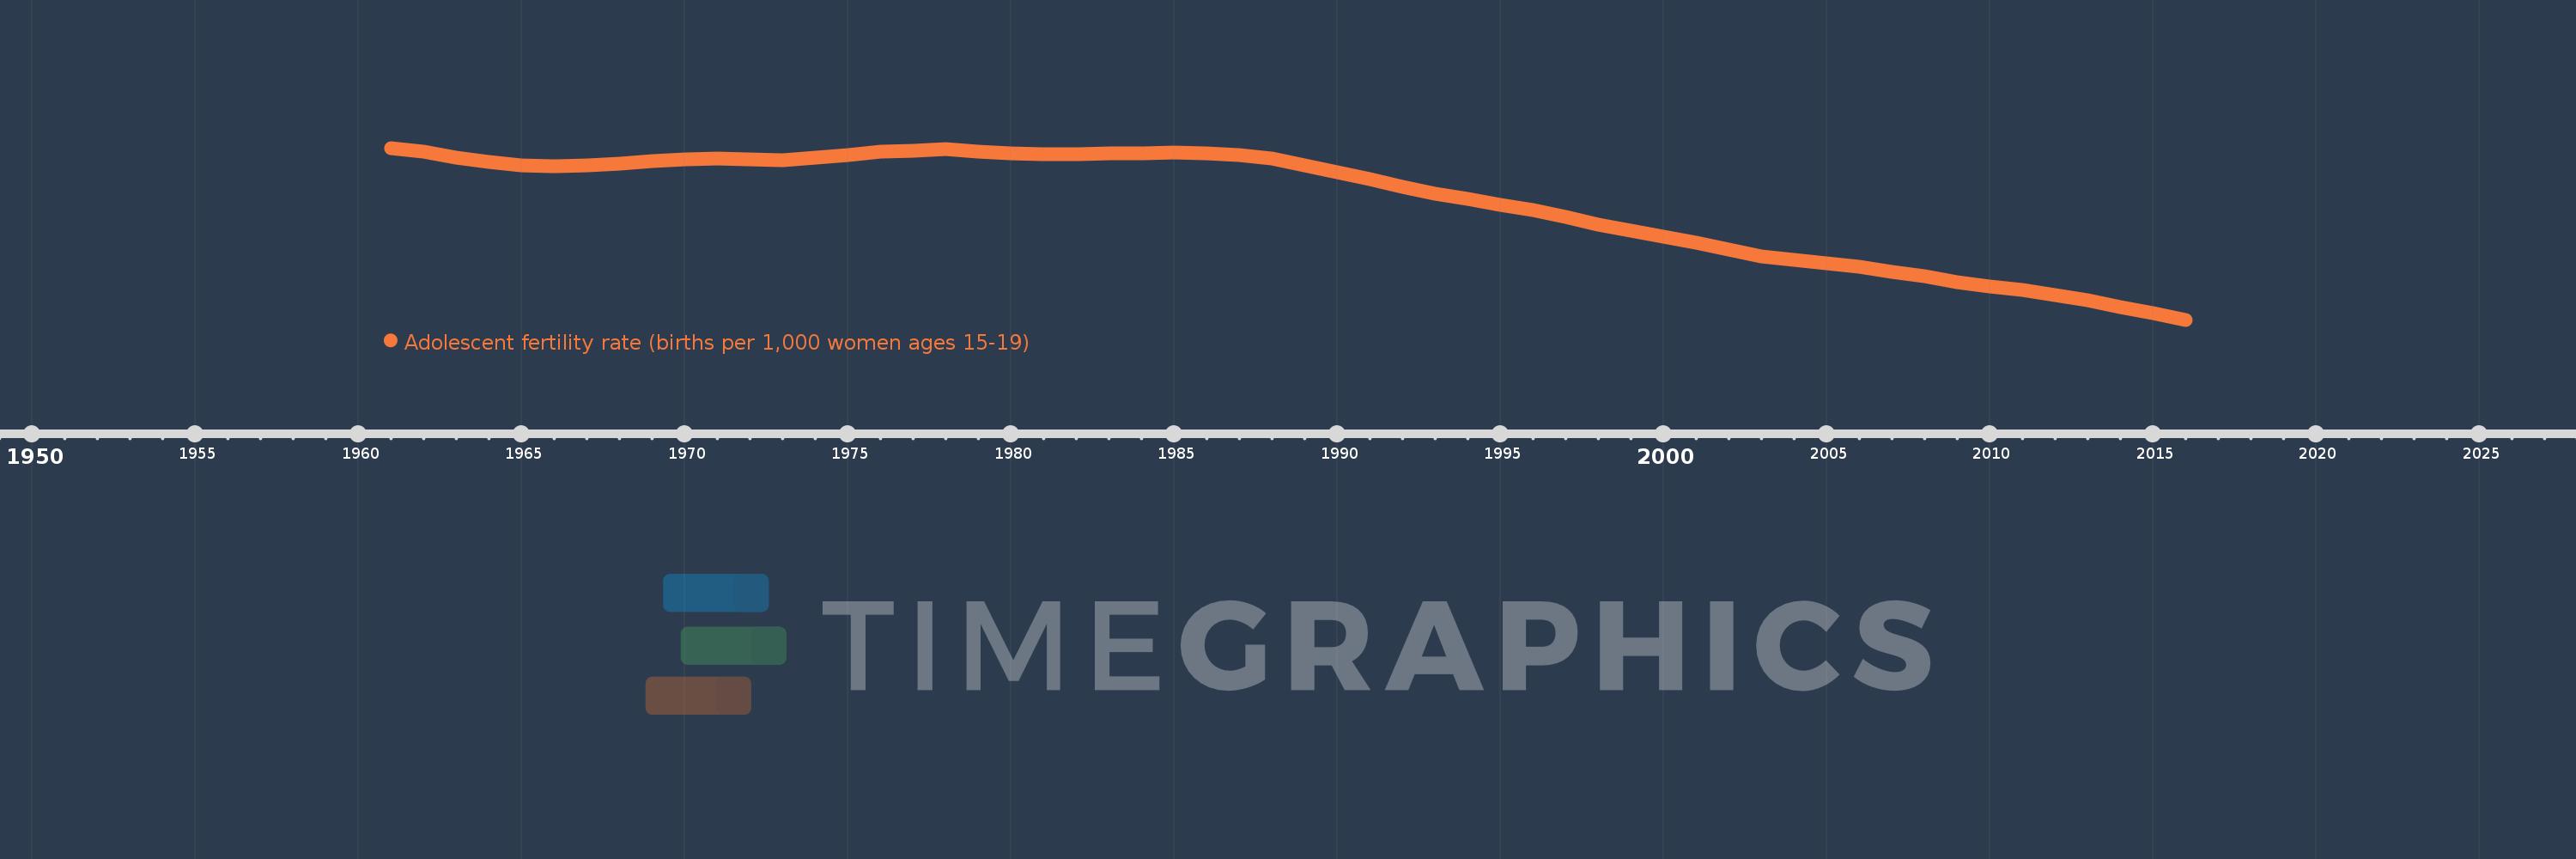
Adolescent fertility rate (births per 1,000 women ages 15-19)
2016,2015,2014,2013,2012,2011,2010,2009,2008,2007,2006,2005,2004,2003,2002,2001,2000,1999,1998,1997,1996,1995,1994,1993,1992,1991,1990,1989,1988,1987,1986,1985,1984,1983,1982,1981,1980,1979,1978,1977,1976,1975,1974,1973,1972,1971,1970,1969,1968,1967,1966,1965,1964,1963,1962,1961
Estas estatísticas em outros países:
AfghanistanAlbaniaAlgeriaAngolaAntigua and BarbudaArab WorldArgentinaArmeniaArubaAustraliaAustriaAzerbaijanBahamas, TheBahrainBangladeshBarbadosBelarusBelgiumBelizeBeninBhutanBoliviaBosnia and HerzegovinaBotswanaBrazilBrunei DarussalamBulgariaBurkina FasoBurundiCabo VerdeCambodiaCameroonCanadaCaribbean small statesCentral African RepublicCentral Europe and the BalticsChadChannel IslandsChileChinaColombiaComorosCongo, Dem. Rep.Congo, Rep.Costa RicaCote d'IvoireCroatiaCubaCuracaoCyprusCzech RepublicDenmarkDjiboutiDominican RepublicEarly-demographic dividendEast Asia & PacificEast Asia & Pacific (excluding high income)East Asia & Pacific (IDA & IBRD countries)EcuadorEgypt, Arab Rep.El SalvadorEquatorial GuineaEritreaEstoniaEthiopiaEuro areaEurope & Central AsiaEurope & Central Asia (excluding high income)Europe & Central Asia (IDA & IBRD countries)European UnionFijiFinlandFragile and conflict affected situationsFranceFrench PolynesiaGabonGambia, TheGeorgiaGermanyGhanaGreeceGrenadaGuamGuatemalaGuineaGuinea-BissauGuyanaHaitiHeavily indebted poor countries (HIPC)High incomeHondurasHong Kong SAR, ChinaHungaryIBRD onlyIcelandIDA & IBRD totalIDA blendIDA onlyIDA totalIndiaIndonesiaIran, Islamic Rep.IraqIrelandIsraelItalyJamaicaJapanJordanKazakhstanKenyaKiribatiKorea, Dem. People’s Rep.Korea, Rep.KuwaitKyrgyz RepublicLao PDRLate-demographic dividendLatin America & Caribbean Latin America & Caribbean (excluding high income)Latin America & the Caribbean (IDA & IBRD countries)LatviaLeast developed countries: UN classificationLebanonLesothoLiberiaLibyaLithuaniaLow & middle incomeLow incomeLower middle incomeLuxembourgMacao SAR, ChinaMacedonia, FYRMadagascarMalawiMalaysiaMaldivesMaliMaltaMauritaniaMauritiusMexicoMicronesia, Fed. Sts.Middle East & North AfricaMiddle East & North Africa (excluding high income)Middle East & North Africa (IDA & IBRD countries)Middle incomeMoldovaMongoliaMontenegroMoroccoMozambiqueMyanmarNamibiaNepalNetherlandsNew CaledoniaNew ZealandNicaraguaNigerNigeriaNorth AmericaNorwayOECD membersOmanOther small statesPacific island small statesPakistanPanamaPapua New GuineaParaguayPeruPhilippinesPolandPortugalPost-demographic dividendPre-demographic dividendPuerto RicoQatarRomaniaRussian FederationRwandaSamoaSao Tome and PrincipeSaudi ArabiaSenegalSerbiaSeychellesSierra LeoneSingaporeSlovak RepublicSloveniaSmall statesSolomon IslandsSomaliaSouth AfricaSouth AsiaSouth Asia (IDA & IBRD)South SudanSpainSri LankaSt. LuciaSt. Vincent and the GrenadinesSub-Saharan Africa Sub-Saharan Africa (excluding high income)Sub-Saharan Africa (IDA & IBRD countries)SudanSurinameSwazilandSwedenSwitzerlandSyrian Arab RepublicTajikistanTanzaniaThailandTimor-LesteTogoTongaTrinidad and TobagoTunisiaTurkeyTurkmenistanUgandaUkraineUnited Arab EmiratesUnited KingdomUnited StatesUpper middle incomeUruguayUzbekistanVanuatuVenezuela, RBVietnamVirgin Islands (U.S.)West Bank and GazaWorldYemen, Rep.ZambiaZimbabwe Linha do tempo:
Nesta escala de tempo está apresentado um gráfico de 1961 ano até 2016 ano Other small states. Dados de 1960 ano ausente. O número de observações reais por data: 56.
Fonte (nome):
Indicadores de desenvolvimento mundial
Fonte (organização):
United Nations Population Division, World Population Prospects.
Categorias:
Health, Gender, Social Development
Foi atualizado:
23 abr 2017 ano
Indicadores de alterações dos valores ao longo dos anos
Mínimo:
61.172
1 jan 2016 ano
Máximo:
99.175
1 jan 1961 ano
Na data de observação
Valor
Mudança absoluta
A alteração em relação ao valor anterior
1 jan 1961 ano
99.175
+99.175
0.0%
1 jan 1962 ano
98.296
-0.878
-0.89%
1 jan 1963 ano
97.045
-1.252
-1.27%
1 jan 1964 ano
96.021
-1.023
-1.05%
1 jan 1965 ano
95.313
-0.708
-0.74%
1 jan 1966 ano
95.082
-0.231
-0.24%
1 jan 1967 ano
95.233
+0.151
0.16%
1 jan 1968 ano
95.686
+0.453
0.48%
1 jan 1969 ano
96.232
+0.546
0.57%
1 jan 1970 ano
96.636
+0.404
0.42%
1 jan 1971 ano
96.755
+0.119
0.12%
1 jan 1972 ano
96.593
-0.161
-0.17%
1 jan 1973 ano
96.522
-0.072
-0.07%
1 jan 1974 ano
97.034
+0.512
0.53%
1 jan 1975 ano
97.655
+0.622
0.64%
1 jan 1976 ano
98.293
+0.638
0.65%
1 jan 1977 ano
98.609
+0.315
0.32%
1 jan 1978 ano
98.913
+0.305
0.31%
1 jan 1979 ano
98.334
-0.58
-0.59%
1 jan 1980 ano
97.937
-0.397
-0.4%
1 jan 1981 ano
97.781
-0.155
-0.16%
1 jan 1982 ano
97.721
-0.06
-0.06%
1 jan 1983 ano
97.889
+0.168
0.17%
1 jan 1984 ano
98.049
+0.16
0.16%
1 jan 1985 ano
98.138
+0.089
0.09%
1 jan 1986 ano
97.999
-0.139
-0.14%
1 jan 1987 ano
97.563
-0.436
-0.44%
1 jan 1988 ano
96.891
-0.672
-0.69%
1 jan 1989 ano
95.345
-1.546
-1.6%
1 jan 1990 ano
93.776
-1.569
-1.65%
1 jan 1991 ano
92.221
-1.554
-1.66%
1 jan 1992 ano
90.59
-1.631
-1.77%
1 jan 1993 ano
89.059
-1.531
-1.69%
1 jan 1994 ano
87.839
-1.22
-1.37%
1 jan 1995 ano
86.634
-1.205
-1.37%
1 jan 1996 ano
85.413
-1.221
-1.41%
1 jan 1997 ano
83.836
-1.577
-1.85%
1 jan 1998 ano
82.266
-1.57
-1.87%
1 jan 1999 ano
80.889
-1.377
-1.67%
1 jan 2000 ano
79.553
-1.336
-1.65%
1 jan 2001 ano
78.192
-1.361
-1.71%
1 jan 2002 ano
76.643
-1.549
-1.98%
1 jan 2003 ano
75.151
-1.492
-1.95%
1 jan 2004 ano
74.393
-0.758
-1.01%
1 jan 2005 ano
73.65
-0.743
-1.0%
1 jan 2006 ano
72.882
-0.768
-1.04%
1 jan 2007 ano
71.757
-1.124
-1.54%
1 jan 2008 ano
70.724
-1.034
-1.44%
1 jan 2009 ano
69.559
-1.165
-1.65%
1 jan 2010 ano
68.606
-0.954
-1.37%
1 jan 2011 ano
67.753
-0.853
-1.24%
1 jan 2012 ano
66.585
-1.167
-1.72%
1 jan 2013 ano
65.501
-1.084
-1.63%
1 jan 2014 ano
64.035
-1.466
-2.24%
1 jan 2015 ano
62.609
-1.425
-2.23%
1 jan 2016 ano
61.172
-1.438
-2.3%
Classificação de países por estatísticas atuais por anos


Comentários: